


http://www.national.com 12
**
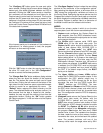
DRCS_Serial
“DRCS_ser_fft.m” is the script
intended for analysis of the DRCS 24-bit serial out-
put data. Fsample is set to a default of 52e6/192
which is the GSM standard output rate of
270.833KS/s. The “search’ option is enabled;
therefore, excluding the DC bins, the peak FFT bin
is assumed to be the input fundamental. A default 4-
term data window is used.
**
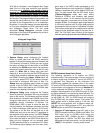
DRCS_Debug
“DRCS_par_fft.m” is the script
intended for analysis of the DRCS 16-20 bit parallel
debug data. The hardware setting will determine the
actual Fsample variable needed. The data is always
placed within a 24-bit word with MSB justification.
The default Fsample is set to the assumed clock
frequency of 52MHz with no decimation. If a debug
port is selected which has decimated data, the
Fsample variable will require an appropriate adjust-
ment. Carefully edit and save the new value into the
script file. The original file can be recovered from the
CDROM.
**
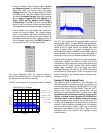
14-bit FFT
“b14_FFT.m” is the script intended for
data analysis in conjunction with the CLC5958 Eval-
uation Board. All the FFT routines can be run with a
rectangular window by setting the variable to “0”.
Setting the “Dither” variable excludes a lower portion
of the spectrum from the FFT analysis and is
intended to be used in conjunction with a base-band
dither signal being present at the ADC analog input.
**
12-bit FFT
“b12_FFT.m” is the script intended for
data analysis in conjunction with the CLC5956
Evaluation Boards.
**
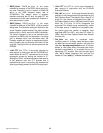
DNL_INL
“dnl_inl.m” - is the script intended for data
analysis of the histogram data file generated by the
Data Capture Board. The data file has a fixed 2^15
length (i.e. the number of histogram bins). SW1 on
the Capture Board is set to LSB justify the ADC data
within the 2^15 bins. 12-18 bit histograms are
supported. This Matlab script automatically scales
to the data source. In addition to the graphic plots,
the routine gives the number of samples, input
amplitude (dBFS of ADC), and data DC offset (in
LSBs). See the Data Capture Board User Manual
for more info.
**
Plot_Data
this script is contained within
“analysis_menu.m”. It simply clears the figure, loads
the data file from the default location, and plots the
new data.
No data manipulation
occurs. If the user
wishes to view offset binary formatted data which
has been normalized to ±1, he should first run the
appropriate FFT analysis, then clear the plot figure
(use
“clf“
at Matlab command line) and plot the
variable
“u”
(use
“plot(u,’.’)”
at Matlab command line).