


http://www.national.com
6
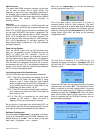
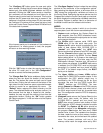
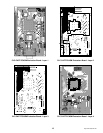
To look at the data that you have just captured, left click
on the “Plot_Data” button. If you have collected data with
a 12-bit ADC at 52MSPS and a -2dBFS sinewave input at
5MHz, you will see two’s complement data that looks like this:
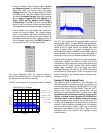
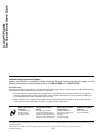
Next, left click on the 12B_FFT button, and you will see
the following FFT plot and performance summary. (Note
that if you are testing a 14-bit ADC you should set SW1
accordingly and click on the 14B_FFT button instead.)
For more information on the Matlab routines, please refer
to section IV of this manual or the “analysis.txt” file in the
Mfiles directory.
Configuring for Histogram Capture
(DNL and INL Analysis)
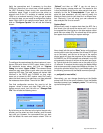
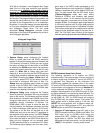
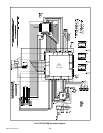
To configure the board for histogram capture, right click
on the capture control panel, then left click on “Configure
Capture.” You will see the capture configuration menu:
Select
“Histogram Debug”
, as shown above, and click on
“OK”.
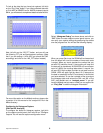
When the data capture control panel returns, you
can verify your capture settings by positioning the mouse
over the progress bar. You will see the following display:
When you press Start now, the SRAM will be cleared and
then the board will count the number of times each code
is output. When any count reaches the number that you
set with DIP switches 4 and 5, the counting will stop and
the data will be transferred. At 52 MSPS and a maximum
count of 16384, the counting takes about 1 second. You
will see LED1 flash as data is written to and read from the
SRAM. LED2 will again light for about 10-15 seconds as
the data is transferred to the PC and stored in the file that
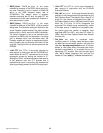
you have selected. To use the included m-files to analyze
the histogram data and extract the DNL and INL of the
ADC, start Matlab and run
“analysis_menu”
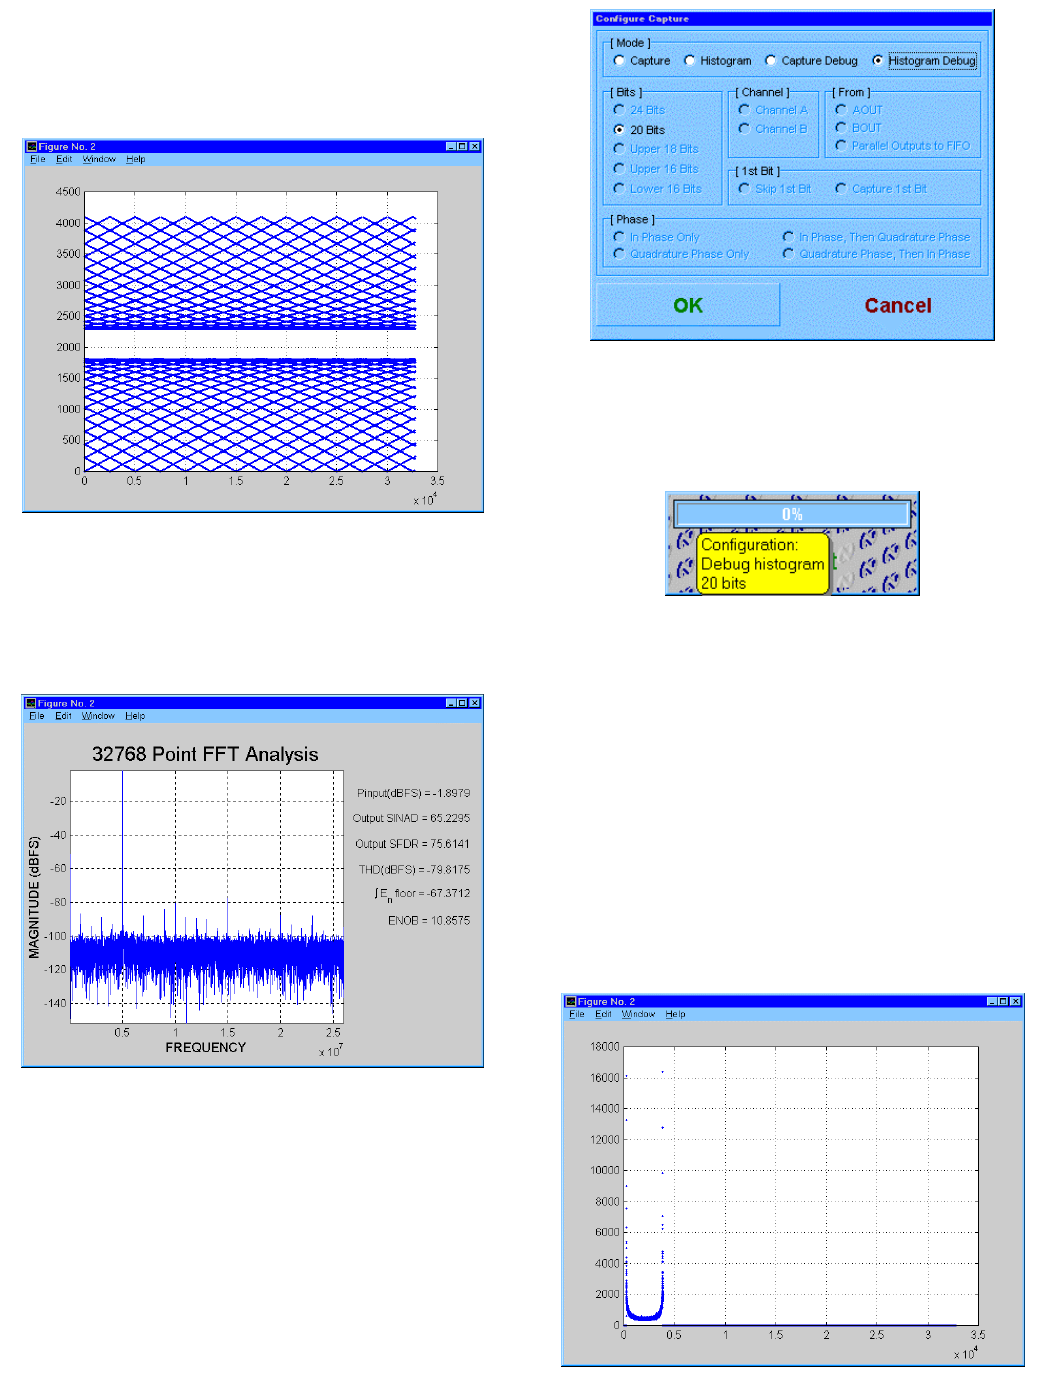
. If you still
have the Matlab analysis menu visible you can again click
on
“Plot_Data”
to see the histogram information: