


5
http://www.national.com
Verify the connections and, if necessary, try the other
COM port. (Note that you must have a clock applied to
the ADC Evaluation board during this communication
verification stage. Check to make sure that either an
external clock or the TTL oscillator is installed, and that
LED6 is on at reduced intensity.) Once you get a proper
exit from this step, you are ready to configure the capture
board. Right click on the capture control panel, then left
click on
“Configure Capture.”
You will see the following
screen:
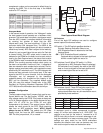
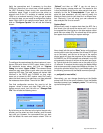
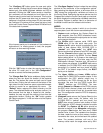
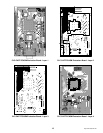
To configure the capture board for direct capture of a con-
tiguous 32k point record of ADC output codes, click on
the selections shown above. Left click on
“Capture
Debug”
and select
“Upper 18 Bits.”
The names of these
selections may seem rather cryptic when you are simply
capturing ADC data. The label names are derived from
functions in the DRCS and CLC5902, so they might
seem out of context for ADC capture uses. Don’t worry
about the label names, just make sure you have selected
the modes as shown above. Then click on
“OK.”
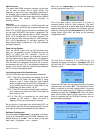
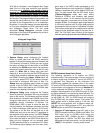
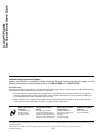
One final configuration remains. You need to tell the
program where to store your data. Right click on the
capture control panel, then left click on
“Change Data
File.”
You will see the following menu:
By left clicking on the little box to the right of the text entry
window, you can select any disk, directory, and file name
that suits you. However, we recommend that you start
with the default file name and location shown. Click on
“Default”
and then on
“OK”
. If you do not have a
C:\temp directory, please make one. The reason for this
is that the Matlab script files for data analysis look auto-
matically for the file
C:\temp\data.dat
. If you wish to
store the data elsewhere, you will need to modify the
Matlab m-files to look for your data file in a different loca-
tion. Obviously, if you are using your own software for
data analysis this is not a concern.
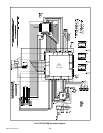
Capture Data!
We are finally ready to capture data from the ADC. As a
final check, you can move the mouse until it is on top of
the progress bar (the big bar on the data capture control
panel that now reads (0%). You should see a little yellow
box appear that confirms your capture settings.
Now, simply left-click on the
“Start”
button on the capture
control panel to start the process. You will see LED 2 light
up on the board, and the bar at the top of the capture
control panel will show the progress of the data transfer.
At 52MSPS, the 32768 samples are collected in only 630
microseconds; the rest of the time is the serial port trans-
fer. Typical times for this transfer are on the order of 10 to
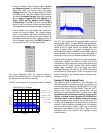
15 seconds. To analyze the data using the Matlab Mfiles
that we have provided, please start Matlab at this time. To
include the provided script files in your Matlab path, type
the following command at the Matlab command prompt:
>> path(path,’c:\nsc\mfiles’)
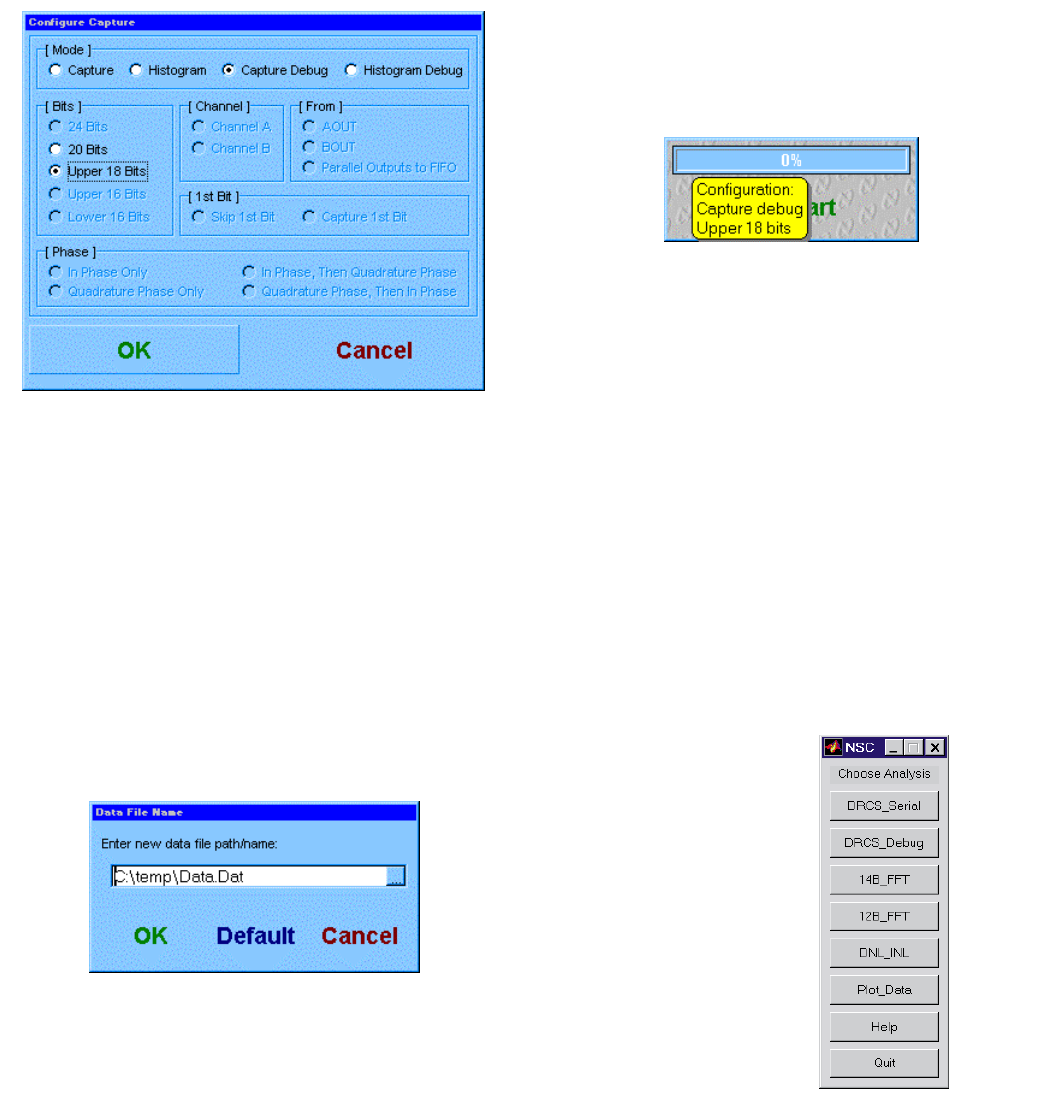
Alternatively, you can change directories at the Matlab
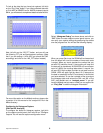
prompt until this is the current directory. From the Matlab
command prompt, type
“analysis_menu”
. This will bring
up the following menu: