IA-32 Intel® Architecture Optimization
3-10
To use any of the SIMD technologies optimally, you must evaluate the
following situations in your code:
• fragments that are computationally intensive
• fragments that are executed often enough to have an impact on
performance
• fragments that with little data-dependent control flow
• fragments that require floating-point computations
• fragments that can benefit from moving data 16 bytes at a time
• fragments of computation that can coded using fewer instructions
• fragments that require help in using the cache hierarchy efficiently
Identifying Hot Spots
To optimize performance, use the VTune Performance Analyzer to find
sections of code that occupy most of the computation time. Such
sections are called the hotspots. For details on the VTune analyzer, see
Appendix A, “Application Performance Tools.”
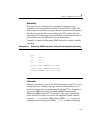
The VTune analyzer provides a hotspots view of a specific module to
help you identify sections in your code that take the most CPU time and
that have potential performance problems. For more, see section
“Sampling” in Appendix A, which includes an example of a hotspots
report. The hotspots view helps you identify sections in your code that
take the most CPU time and that have potential performance problems.
The VTune analyzer enables you to change the view to show hotspots
by memory location, functions, classes, or source files. You can
double-click on a hotspot and open the source or assembly view for the
hotspot and see more detailed information about the performance of
each instruction in the hotspot.
The VTune analyzer offers focused analysis and performance data at all
levels of your source code and can also provide advice at the assembly
language level. The code coach analyzes and identifies opportunities for
better performance of C/C++, Fortran and Java* programs, and suggests


