Application Performance Tools A
A-19
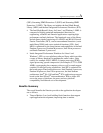
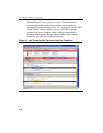
Figure A-2 shows Intel Thread Checker displaying the source code of
the selected instance from a list of detected data race conditions that
occurred during threaded execution. The target operands (a
synchronization variable shared by more than one threads) of the race
condition, the type of data operation on the target operand, and source
code locations are displayed in the graphical user interface.
Thread Profiler
The thread profiler is a plug-in data collector for the Intel VTune
Performance Analyzer. Use it to analyze threading performance and
identify parallel performance problems. The thread profiler graphically
illustrates what each thread is doing at various levels of detail using a
hierarchical summary. It can identify inactive threads, critical paths and
imbalances in thread execution, etc. Mountains of data are collapsed
into relevant summaries, sorted to identify parallel regions or loops that
require attention. Its intuitive, color-coded displays make it easy to
assess your application's performance.
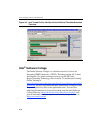
Figure A-3 shows the execution timeline of a multi-threaded application
when run in (a) a single-threaded environment, (b) a multi-threaded
environment capable of executing two threads simultaneously, (c) a
multi-threaded environment capable of executing four threads
simultaneously. In Figure A-3, the color-coded timeline of three
hardware configurations are super-imposed together to compare
processor scaling performance and illustrate the imbalance of thread
execution.
Load imbalance problem is visually identified in the two-way platform
by noting that there is a significant portion of the timeline, during which
one logical processor had no task to execute. In the four-way platform,
one can easily identify those portions of the timeline of three logical
processors, each having no task to execute.


