


IA-32 Intel® Architecture Optimization
6-30
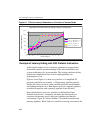
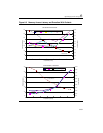
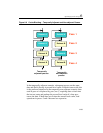
Figure 6-5Figure demonstrates the effectiveness of software prefetches
in latency hiding. The X axis indicates the number of computation
clocks per loop (each iteration is independent). The Y axis indicates the
execution time measured in clocks per loop. The secondary Y axis
indicates the percentage of bus bandwidth utilization. The tests vary by
the following parameters:
1. The number of load/store streams. Each load and store stream
accesses one 128-byte cache line each, per iteration.
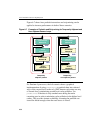
2. The amount of computation per loop. This is varied by increasing
the number of dependent arithmetic operations executed.
3. The number of the software prefetches per loop. (for example, one
every 16 bytes, 32 bytes, 64 bytes, 128 bytes).
As expected, the leftmost portion of each of the graphs in Figure 6-5
shows that when there is not enough computation to overlap the latency
of memory access, prefetch does not help and that the execution is
essentially memory-bound. The graphs also illustrate that redundant
prefetches do not increase performance.