


© National Instruments Corporation 3-1 MATRIXx Xmath Robust Control Module
3
System Evaluation
This chapter describes system analysis functions that create singular value
Bode plots, performance plots, and calculate the L
∞
norm of a linear
system.
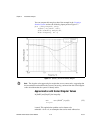
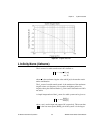
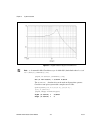
Singular Value Bode Plots
The singular value Bode plot is a MIMO generalization of the bode( )
magnitude plot. It is calculated as
where
and
In these equations, σ
i
(H(jw)) can be thought of as the maximum gain of the
system at frequency ω, and σ
k
(H(jw)) can be thought of as the minimum
gain of the system at frequency ω.
If σ
i
(H(jw)) » σ
k
(H(jw)), then at the frequency ω, the system gain can be
large for some input directions and small for other input directions.
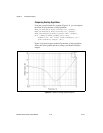
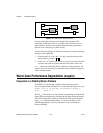
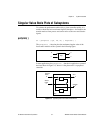
The singular value plot allows you to generalize to the MIMO case notions
such as “the command-to-tracking error transfer function is small” or “the
loop gain is large.” For example:
• If the system represents the command-to-tracking error for a
closed-loop system, then you would hope that σ
1
, and hence all
σ values, are small over the bandwidth of the system. This means
that the command-to-tracking error is small in all directions at these
frequencies.
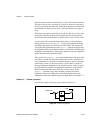
• The singular value plot of a certain transfer matrix gives a lower bound
on the stability margin of the system.
σ
i
Hjw()(), i 1…k=
kminn
inputs
n
outputs
(, )()=
σ
1
H() σ
2
H() … σ
k
H() 0≥≥≥≥