


Chapter 3 System Evaluation
© National Instruments Corporation 3-7 MATRIXx Xmath Robust Control Module
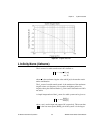
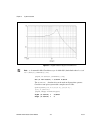
Singular Value Bode Plots of Subsystems
To evaluate the performance achieved by a given controller rapidly, it is
useful to check four basic maximum singular value plots—for example, the
transfer matrices from process and sensor noises to the error and actuator
signals.
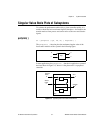
perfplots( )
SV = perfplots ( Sys, nd, ne, { keywords } )
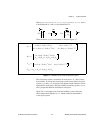
The perfplots( ) function plots the maximum singular value of the
four transfer matrices of the system in the following figure.
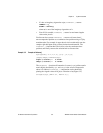
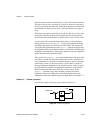
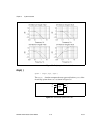
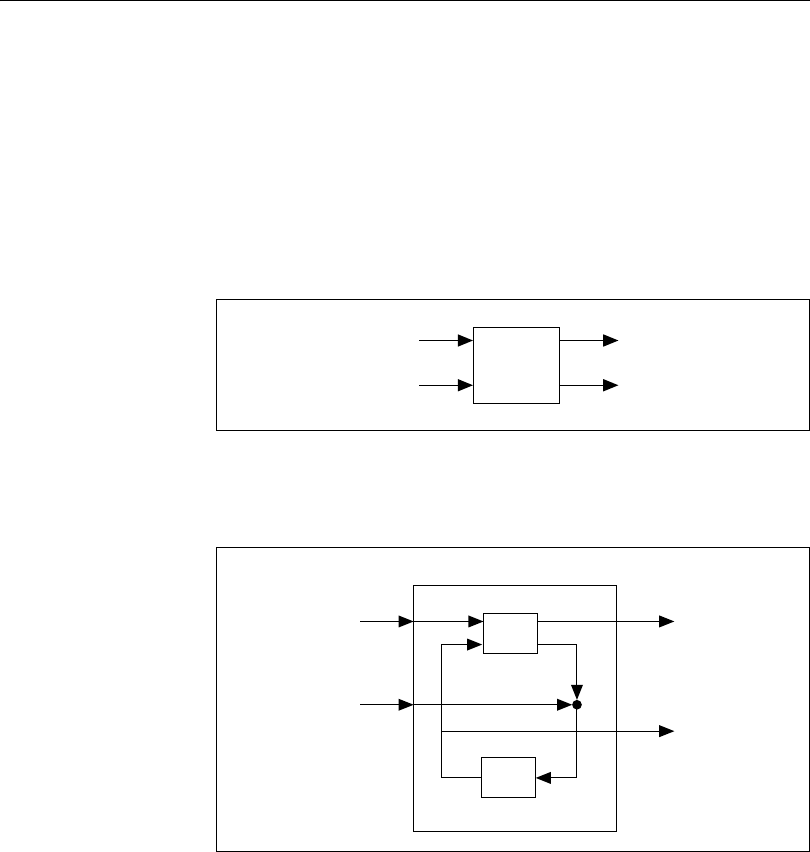
In most applications, the
perfplots( ) function is applied to a system of
the form shown in Figure 3-3, where
P is the plant and K is a proposed
controller.
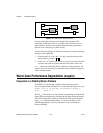
Figure 3-3. Typical System with Plant and Controller
Sys
d
n
e
u
Sys
d
n
e
uy
u
P
K
process
noise
sensor
noise
actuato
r
error