


Chapter 4 Theory of Operation
SCXI-1503 User Manual 4-8 ni.com
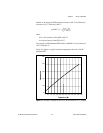
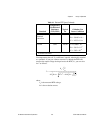
Although the resistance-temperature curve is relatively linear, accurately
converting measured resistance to temperature requires curve fitting. The
following Callendar-Van Dusen equation is commonly used to approximate
the RTD curve:
where
R
T
is the resistance of the RTD at temperature T.
R
0
is the resistance of the RTD at 0 °C.
A, B, and C are the Callendar-Van Dusen coefficients shown in
Table 4-1.
T is the temperature in °C.
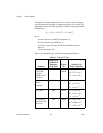
Table 4-1 lists the RTD types and their corresponding coefficients.
Table 4-1. Platinum RTD Types
Standard
Temperature
Coefficient of
Resistance
(TCR, PPM)
Typical
R
0
Callendar-Van
Dusen Coefficient
IEC-751
DIN 43760
BS 1904
ASTM-E1137
EN-60751
3851 100 Ω
1000 Ω
A = 3.9083 × 10
–3
B = –5.775 × 10
–7
C = –4.183 × 10
–12
Low cost
vendor
compliant
1
3750 1000 Ω A = 3.81 × 10
–3
B = –6.02 × 10
–7
C = –6.0 × 10
–12
JISC 1604 3916 100 Ω A = 3.9739 × 10
–3
B = –5.870 × 10
–7
C = –4.4 × 10
–12
US Industrial
Standard D-100
American
3920 100 Ω A = 3.9787 × 10
–3
B = –5.8686 × 10
–7
C = –4.167 × 10
–12
R
T
R
0
1 AT BT
2
CT 100–()
3
++ +[]=