5.5 Viewing the Trace Information
For the description on the trace function, refer to section 2.2, Trace Functions.
Note: The R8C/Tiny series MCUs do not have trace functions.
5.5.1 Opening the [Trace] Window
To open the [Trace] window, choose [View -> Code -> Trace] or click the [Trace] toolbar button
(
).
5.5.2 Acquiring Trace Information
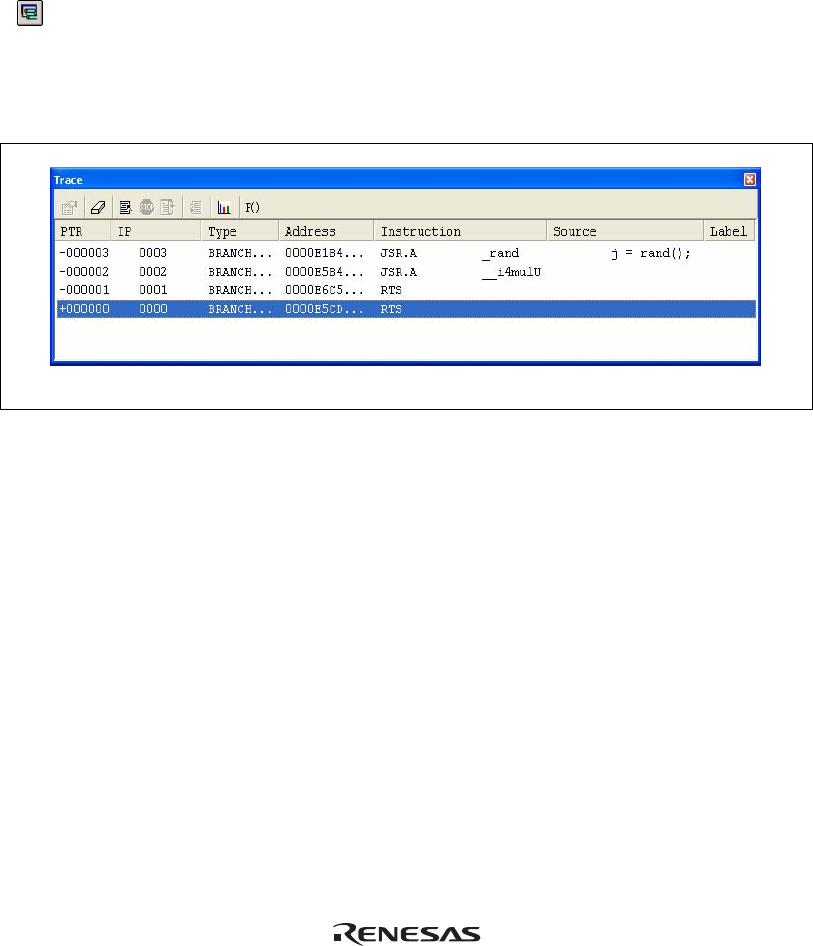
The acquired trace information is displayed in the [Trace] window.
Figure 5.9 [Trace] Window
This window displays the following trace information items:
[PTR] Pointer to a location in the trace buffer (+0 for the last executed instruction)
[IP] The amount of acquired trace information
[Type] Type of branch:
BRANCH: branch source
[Address] Instruction address
[Instruction] Instruction mnemonic
[Source] The C/C++ or assembly-language source program
[Label] Label information
It is possible to hide any column not necessary in the [Trace] window. Selecting a column you
want to hide from the popup menu displayed by clicking the right-hand mouse button on the
header column hides that column. To display the hidden column, select the column from the said
popup menu again.
Note: The number of branch instructions that can be acquired by a trace and the trace display
differ depending on the product. For the specification of each product, refer to the online
help.
87


