


Prestige 2602H/HW Series User’s Guide
282 Chapter 22 Maintenance
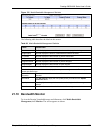
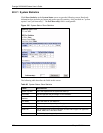
22.2.1 System Statistics
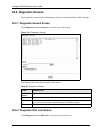
Click Show Statistics in the System Status screen to open the following screen. Read-only
information here includes port status and packet specific statistics. Also provided are "system
up time" and "poll interval(s)". The Poll Interval(s) field is configurable.
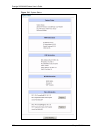
Figure 135 System Status: Show Statistics
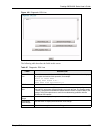
The following table describes the fields in this screen.
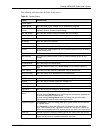
Table 92 System Status: Show Statistics
LABEL DESCRIPTION
System up Time This is the elapsed time the system has been up.
CPU Load This field specifies the percentage of CPU utilization.
LAN or WAN Port
Statistics
This is the WAN or LAN port.
Link Status This is the status of your WAN link.
Upstream Speed This is the upstream speed of your Prestige.
Downstream Speed This is the downstream speed of your Prestige.
Node-Link This field displays the remote node index number and link type. Link types are
PPPoA, ENET, RFC 1483 and PPPoE.
Interface This field displays the type of port.