


20050501
13-2-2
Spreadsheet Application Menus and Buttons
k Graph Menu
You can use the [Graph] menu to graph the data contained in selected cells. See
“13-8 Graphing” for more information.
k Action Menu
The [Action] menu contains a selection of functions that you can use when configuring a
spreadsheet. See “13-6 Using the Action Menu” for more information.
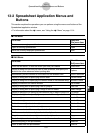
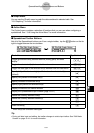
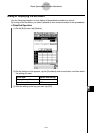
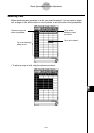
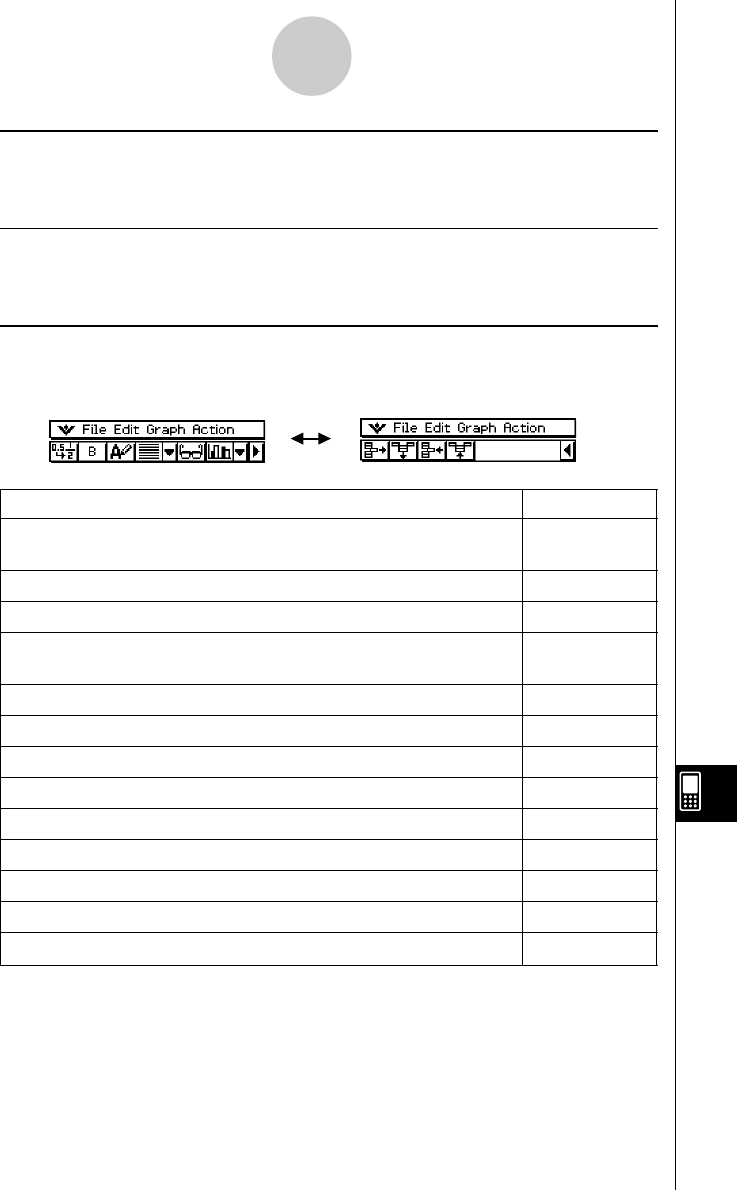
k Spreadsheet Toolbar Buttons
Not all of the Spreadsheet buttons can fit on a single toolbar, tap the u/t button on the far
right to toggle between the two toolbars.
To do this: Tap this button:
Toggle the selected cell(s) between decimal (floating point) and exact
.
/
,
display*
1
Toggle the selected cell(s) between bold and normal M
/
B
Toggle the data type of the selected cell(s) between text and calculation u
/
<
Specify left-justified text and right-justified values for selected cell(s)
[
(default)
Specify left-justified for selected cell(s) p
Specify centered for selected cell(s) x
Specify right-justified for selected cell(s) ]
Display or hide the Cell Viewer window A
Display the Spreadsheet Graph window (page 13-8-1) o
Delete the currently selected row(s) H
Delete the currently selected column(s) J
Insert row(s) K
Insert column(s) a
*
1
When cell(s) are calculation data types.
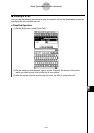
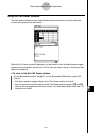
Tip
• During cell data input and editing, the toolbar changes to a data input toolbar. See “Edit Mode
Screen” on page 13-4-1 for more information.