


20050501
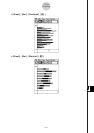
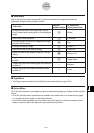
k View Menu
Many of the [View] menu commands can also be executed by tapping Spreadsheet
application Graph window toolbar buttons.
To do this:
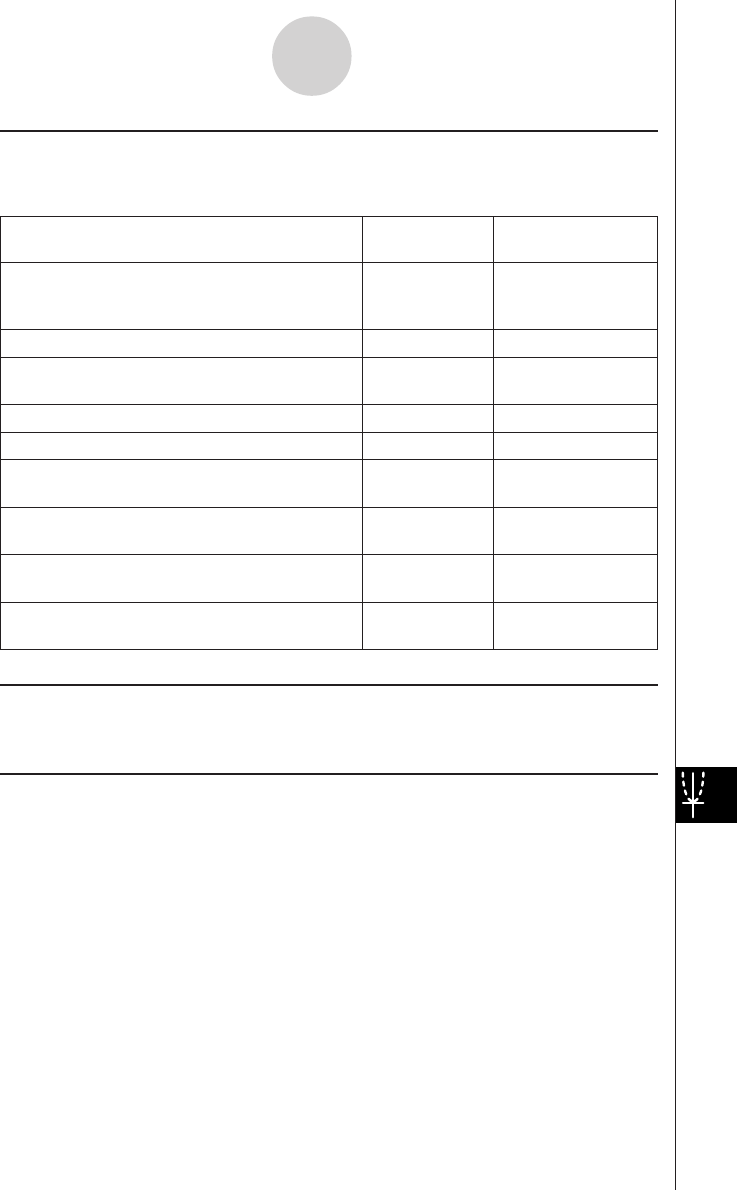
Tap this Or select this
toolbar button: [View] menu item:
Change the function of the stylus so it can be
used to select and move points on the displayed G Select
graph
Start a box zoom operation Q Zoom Box
Activate the pan function for dragging the Graph
T Pan
window with the stylus
Enlarge the display image W Zoom In
Reduce the size of the display image E Zoom Out
Adjust the size of the display image so it fits the
R Zoom to Fit
display
Toggle display of axes and coordinate values on
q Toggle Axes
and off
Toggle line graph and scatter graph plot markers
—Markers
on and off
Toggle line graph and scatter connecting lines
—Lines
on and off
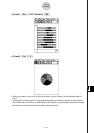
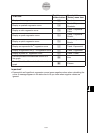
k Type Menu
• The [Type] menu is identical to the [Graph] menu described on page 13-8-1.
k Series Menu
All of the [Series] menu commands can also be executed by tapping a Graph window toolbar
button.
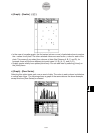
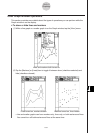
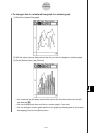
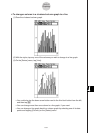
•All of the [Series] menu operations are available only when there is a clustered line graph
or a clustered column graph on the Graph window.
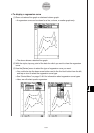
• In all of the following cases, you first need to tap a plot point or a column to specify which
data you want to use for the operation you are about to perform.
13-8-9
Graphing