


20070201
5-6-1
Manual Graphing
5-6 Manual Graphing
k Rectangular Coordinate Graph
Description
Inputting the Graph command in the RUN
•
MAT mode enables drawing of rectangular
coordinate graphs.
Set Up
1. From the Main Menu, enter the RUN
•
MAT mode.
2. Make V-Window settings.
Execution
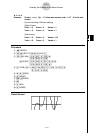
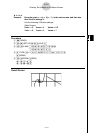
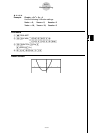
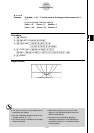
3. Input the commands for drawing the rectangular coordinate graph.
4. Input the function.
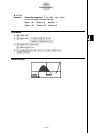
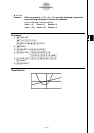
# Certain functions can be graphed easily using built-in function graphs.
# You can draw graphs of the following built-in scientifi c functions.
• Rectangular Coordinate Graph
• sin x • cos x • tan x • sin
–1
x • cos
–1
x
• tan
–1
x • sinh x • cosh x • tanh x • sinh
–1
x
• cosh
–1
x • tanh
–1
x • ' x • x
2
• log x
• ln x • 10
x
• e
x
• x
–1
•
3
' x
• Polar Coordinate Graph
• sin
θ
• cos
θ
• tan
θ
• sin
–1
θ
• cos
–1
θ
• tan
–1
θ
• sinh
θ
• cosh
θ
• tanh
θ
• sinh
–1
θ
• cosh
–1
θ
• tanh
–1
θ
• '
θ
•
θ
2
• log
θ
• ln
θ
• 10
θ
• e
θ
•
θ
–1
•
3
'
θ
• Input for
x and
θ
variables is not required for a built-in function.
• When inputting a built-in function, other operators or values cannot be input.
• Built-in function graph statements cannot be used as part of a multi-statement or in a program.
# V-Window settings are made automatically for built-in graphs.