


20070201
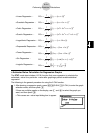
• Linear Regression ...
M
Se =
Σ
1
n – 2
i=1
n
(y
i
– (ax
i
+ b))
2
• Quadratic Regression ...
M
Se =
Σ
1
n – 3
i=1
n
(y
i
– (ax
i
+ bx
i
+ c))
2
2
• Cubic Regression ...
M
Se =
Σ
1
n – 4
i=1
n
(yi – (axi
3
+ bxi + cxi
+ d ))
2
2
• Quartic Regression ...
M
Se =
Σ
1
n – 5
i=1
n
(y
i
– (ax
i
4
+ bx
i
3
+ cx
i
+ dx
i
+ e))
2
2
• Logarithmic Regression ...
M
Se =
Σ
1
n – 2
i=1
n
(y
i
– (a + b ln x
i
))
2
• Exponential Repression ...
M
Se =
Σ
1
n – 2
i=1
n
(ln y
i
– (ln a + bx
i
))
2
• Power Regression ...
M
Se =
Σ
1
n – 2
i=1
n
(ln y
i
– (ln a + b ln x
i
))
2
• Sin Regression ...
M
Se =
Σ
1
n – 2
i=1
n
(y
i
– (a sin (bx
i
+ c) + d ))
2
• Logistic Regression ...
M
Se =
Σ
1
n – 2 1 + ae
-bx
i
C
i=1
n
y
i
–
2
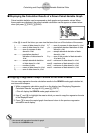
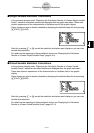
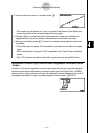
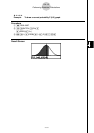
u Estimated Value Calculation for Regression Graphs
The STAT mode also includes a Y-CAL function that uses regression to calculate the
estimated y -value for a particular x -value after graphing a paired-variable statistical
regression.
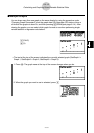
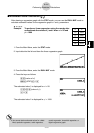
The following is the general procedure for using the Y-CAL function.
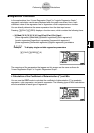
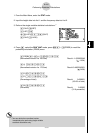
1. After drawing a regression graph, press !5 (G-SLV)1 (Y-CAL) to enter the graph
selection mode, and then press w .
If there are multiple graphs on the display, use f and c to select the graph you
want, and then press w .
• This causes an x -value input dialog box to appear.
6-4-4
Performing Statistical Calculations