


20070201
0-1-1
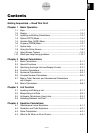
Getting Acquainted
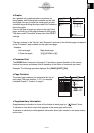
u Graphs
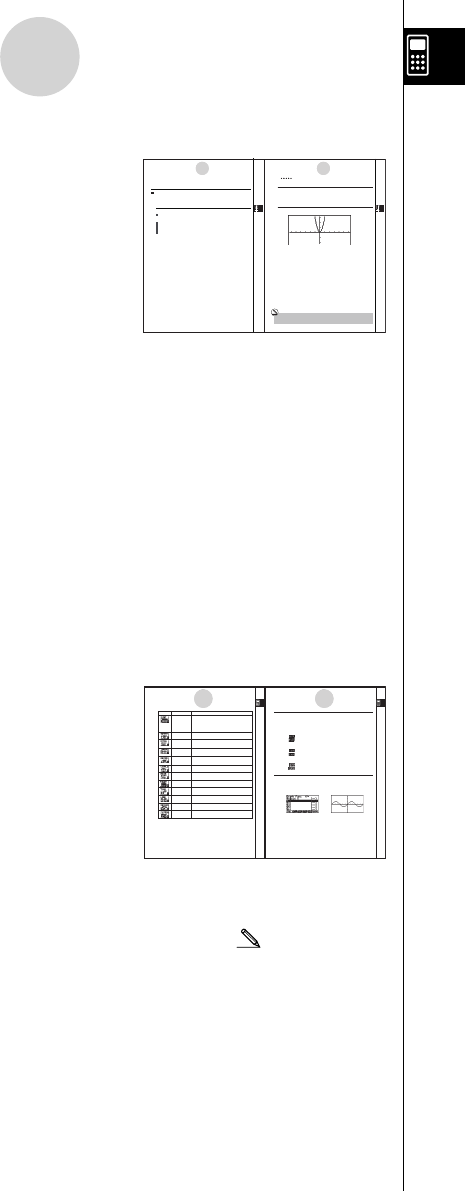
As a general rule, graph operations are shown on
facing pages, with actual graph examples on the right
hand page. You can produce the same graph on your
calculator by performing the steps under the Procedure
above the graph.
Look for the type of graph you want on the right hand
page, and then go to the page indicated for that graph.
The steps under “Procedure” always use initial RESET
settings.
The step numbers in the “Set Up” and “Execution” sections on the left hand page correspond
to the “Procedure” step numbers on the right hand page.
Example:
Left hand page Right hand page
3. Draw the graph. 3 5 (DRAW)(or w )
u Command List
The PRGM Mode Command List (page 8-7) provides a graphic fl owchart of the various
function key menus and shows how to maneuver to the menu of commands you need.
Example: The following operation displays Xfct: [VARS] - [FACT] - [Xfct]
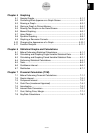
u Page Contents
Three-part page numbers are centered at the top of
each page. The page number “1-2-3”, for example,
indicates Chapter 1, Section 2, page 3.
u Supplementary Information
Supplementary information is shown at the bottom of each page in a “ (Notes)” block.
*
indicates a note about a term that appears in the same page as the note.
# indicates a note that provides general information about topic covered in the same section
as the note.
5-1-1
Sample Graphs
5-1-2
Sample Graphs
20070201
5-1 Sample Graphs
kk
kk
kHow to draw a simple graph (1)
Description
Todraw a graph, simply input the applicable function.
Set Up
1. From the Main Menu, enter the GRAPH Mode.
Execution
2. Input the function you want to graph.
Here you would use the V-Window to specify the range and other parameters of the
graph. See 5-2-1.
3. Draw the graph.
20070201
Example To graph y = 3x
2
Procedure
1m GRAPH
2dvxw
36(DRAW) (or w)
Result Screen
# Pressing Awhile a graph is on the display
will return to the screen in step 2.
20070201
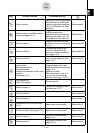
1-2-2
Display
Icon Mode Name Description
S
•
SHT Use this mode to perform spreadsheet calculations. Each file
(Spreadsheet) contains a 26-column ⋅ 999-line spreadsheet. In addition to
the calculator’s built-in commands and S
•
SHT mode
commands, you can also perform statistical calculations and
graph statistical data using the same procedures that you use
in the STATmode.
GRAPH Use this mode to store graph functions and to draw graphs
using the functions.
DYNA Use this mode to store graph functions and to draw multiple
(Dynamic Graph) versions of a graph by changing the values assigned to the
variables in a function.
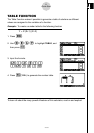
TABLE Use this mode to store functions, to generate a numeric
table of different solutions as the values assigned to
variables in a function change, and to draw graphs.
RECUR Use this mode to store recursion formulas, to generate a
(Recursion) numeric table of different solutions as the values assigned to
variables in a function change, and to draw graphs.
CONICS Use this mode to draw graphs of conic sections.
EQUA Use this mode to solve linear equations with two through six
(Equation) unknowns, quadratic equations, and cubic equations.
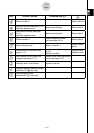
PRGM Use this mode to store programs in the program area and to
(Program) run programs.
TVM Use this mode to perfo rm financial calculations an d to draw
(Financial) cash flow and other types of graphs. to make
LINK Use this mode to transfer memory contents or back-up data
to another unit or PC.
MEMORY Use this mode to manage data stored in memory.
SYSTEM Use this mode to initialize memory, adjust contrast, and to
make other system settings.
20070201
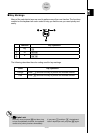
kk
kk
kAbout the Function Menu
Use the function keys (1 to 6) to access the menus and commands in the menu bar
along the bottom of the display screen. You can tell whether a menu bar item is a menu or a
command by its appearance.
• Next Menu
Example:
Selecting displays a menu of hyperbolic functions.
• Command Input
Example:
Selecting inputs the sinh command.
• Direct Command Execution
Example:
Selecting executes the DRAW command.
kk
kk
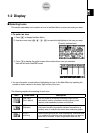
kAbout Display Screens
This calculator uses two types of display screens: a text screen and a graph screen. The text
screen can show 21 columns and 8 lines of characters, with the bottom line used for the
function key menu. The graph screen uses an area that measures 127 (W) ⋅ 63 (H) dots.
Text Screen Graph Screen
The contents of each type of screen are stored in independent memory areas.
Press !6(G
?
T) to switch between the graph screen and text screen.
1-2-3
Display
1-2-2
Display
1-2-3
Display
20070201
1-2-2
Display
Icon Mode Name Description
S
•
SHT Use this mode to perform spreadsheet calculations. Each file
(Spreadsheet) contains a 26-column ⋅ 999-line spreadsheet. In addition to
the calculator’s built-in commands and S
•
SHT mode
commands, you can also perform statistical calculations and
graph statistical data using the same procedures that you use
in the STATmode.
GRAPH Use this mode to store graph functions and to draw graphs
using the functions.
DYNA Use this mode to store graph functions and to draw multiple
(Dynamic Graph) versions of a graph by changing the values assigned to the
variables in a function.
TABLE Use this mode to store functions, to generate a numeric
table of different solutions as the values assigned to
variables in a function change, and to draw graphs.
RECUR Use this mode to store recursion formulas, to generate a
(Recursion) numeric table of different solutions as the values assigned to
variables in a function change, and to draw graphs.
CONICS Use this mode to draw graphs of conic sections.
EQUA Use this mode to solve linear equations with two through six
(Equation) unknowns, quadratic equations, and cubic equations.
PRGM Use this mode to store programs in the program area and to
(Program) run programs.
TVM Use this mode to perfo rm financial calculations an d to draw
(Financial) cash flow and other types of graphs. to make
LINK Use this mode to transfer memory contents or back-up data
to another unit or PC.
MEMORY Use this mode to manage data stored in memory.
SYSTEM Use this mode to initialize memory, adjust contrast, and to
make other system settings.
20070201
kk
kk
kAbout the Function Menu
Use the function keys (1 to 6) to access the menus and commands in the menu bar
along the bottom of the display screen. You can tell whether a menu bar item is a menu or a
command by its appearance.
• Next Menu
Example:
Selecting displays a menu of hyperbolic functions.
• Command Input
Example:
Selecting inputs the sinh command.
• Direct Command Execution
Example:
Selecting executes the DRAW command.
kk
kk
kAbout Display Screens
This calculator uses two types of display screens: a text screen and a graph screen. The text
screen can show 21 columns and 8 lines of characters, with the bottom line used for the
function key menu. The graph screen uses an area that measures 127 (W) ⋅ 63 (H) dots.
Text Screen Graph Screen
The contents of each type of screen are stored in independent memory areas.
Press !6(G
?
T) to switch between the graph screen and text screen.
1-2-3
Display
1-2-2
Display
1-2-3
Display