


20070201
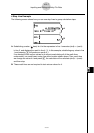
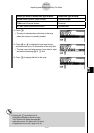
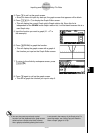
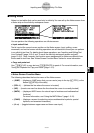
3. Press w to call up the graph screen.
• Since you have not input any data yet, the graph screen that appears will be blank.
4. Press !6 (G ↔ T) to display the Graph Editor screen.
• This will display the current Graph strip’s Graph relation list. Since this list is
independent of the GRAPH mode Graph relation list, it will be blank because this is a
new Graph strip.
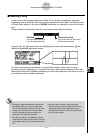
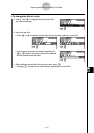
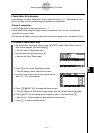
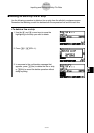
5. Input the function you want to graph (Y1 = X
2
in
this example).
6. Press 6 (DRAW) to graph the function.
• This will display the graph screen with a graph of
the function you input on the Graph Editor screen.
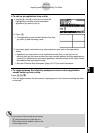
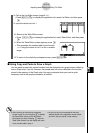
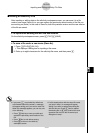
7. To return to the eActivity workspace screen, press
! a ( ' ).
8. Press w again to call up the graph screen.
• This will re-graph the function you input in step 5.
10-3-14
Inputting and Editing eActivity File Data
# You can also paste a previously copied
function from the clipboard into a graph screen
called up from a Graph strip. Note, however,
that a graph produced by pasting the function
is not stored in the memory of the Graph strip. For
more information, see “Using Copy and Paste to
Draw a Graph” (page 10-3-16).