


20070201
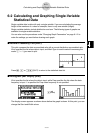
6-2 Calculating and Graphing Single-Variable
Statistical Data
Single-variable data is data with only a single variable. If you are calculating the average
height of the members of a class for example, there is only one variable (height).
Single-variable statistics include distribution and sum. The following types of graphs are
available for single-variable statistics.
You can also use the procedures under “Changing Graph Parameters” on page 6-1-2 to
make the settings you want before drawing each graph.
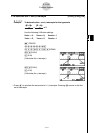
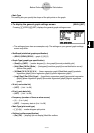
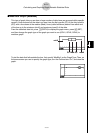
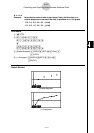
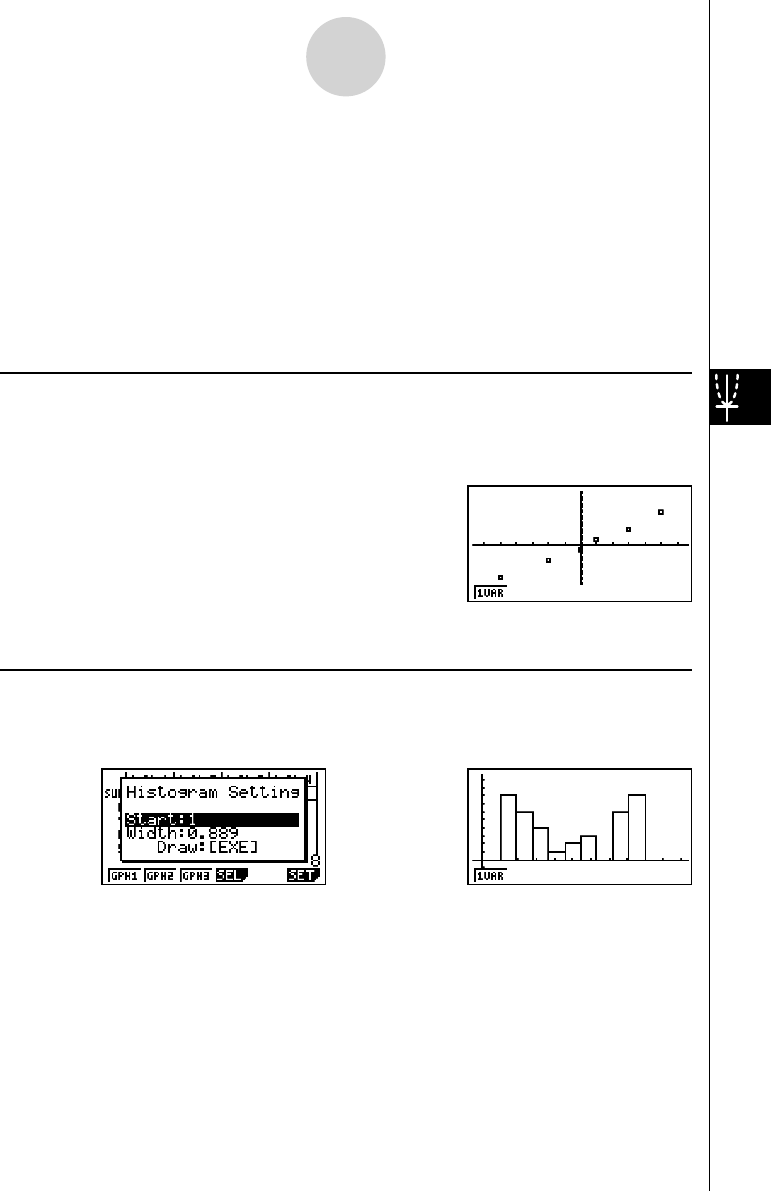
k Normal Probability Plot (NPP)
This plot compares the data accumulated ratio with a normal distribution accumulated ratio.
XList specifi es the list where data is input, and Mark Type is used to select from among the
marks { ٗ / × / • }you want to plot.
Press A , J or !J (QUIT) to return to the statistical data list.
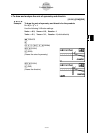
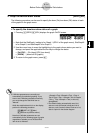
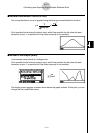
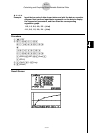
k Histogram ( Bar Graph) (Hist)
XList specifi es the list where the data is input, while Freq specifi es the list where the data
frequency is input. 1 is specifi ed for Freq when frequency is not specifi ed.
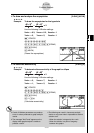
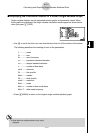
w (Draw)
The display screen appears as shown above before the graph is drawn. At this point, you can
change the Start and Width values.
⇒⇒
6-2-1
Calculating and Graphing Single-Variable Statistical Data