


20070201
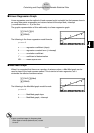
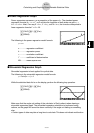
k Selecting the Regression Type
After you graph paired-variable statistical data, press 1 (CALC). Then you can use the
function menu at the bottom of the display to select from a variety of different types of
regression.
• { 2VAR } ... {paired-variable statistical results}
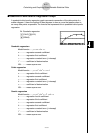
• { X } / { Med } / { X^2 } / { X^3 } / { X^4 } / { Log } / { Exp } / { Pwr } / { Sin } / { Lgst }
... {linear regression}/{Med-Med}/{quadratic regression}/{cubic regression}/{quartic
regression}/{logarithmic regression}/{exponential regression}/{power regression}/
{sinusoidal regression}/{logistic regression} calculation and graphing
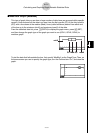
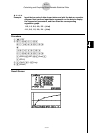
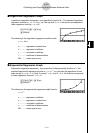
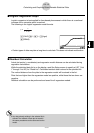
k Displaying Regression Calculation Results
Whenever you perform a regression calculation, the regression formula parameter (such as
a and b in the linear regression y = ax + b ) calculation results appear on the display. You can
use these to obtain statistical calculation results.
Regression parameters are calculated as soon as you press a function key to select a
regression type, while a graph is on the display.
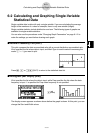
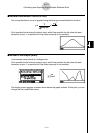
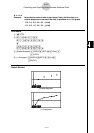
k Graphing Statistical Calculation Results
While the parameter calculation result is on the display, you can graph the displayed
regression formula by pressing 6 (DRAW).
6-3-5
Calculating and Graphing Paired-Variable Statistical Data