


20070201
The graph conditions that are required depends on the graph type. See “Changing Graph
Parameters” (page 6-1-2).
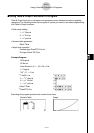
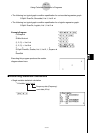
• The following is a typical graph condition specifi cation for a scatter diagram or
xy Line
graph.
S-Gph1 DrawOn, Scatter, List 1, List 2, 1, Square _
In the case of an
xy line graph, replace “Scatter” in the above specifi cation with “ xy Line”.
• The following is a typical graph condition specifi cation for a normal probability plot.
S-Gph1 DrawOn, NPPlot, List 1, Square _
• The following is a typical graph condition specifi cation for a single-variable graph.
S-Gph1 DrawOn, Hist, List 1, List 2 _
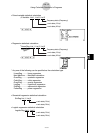
The same format can be used for the following types of graphs, by simply replacing “Hist” in
the above specifi cation with the applicable graph type.
Histogram: .....................................Hist
Median Box: ...................................MedBox*
1
Normal Distribution: .......................N-Dist
Broken Line: ...................................Broken
• The following is a typical graph condition specifi cation for a regression graph.
S-Gph1 DrawOn, Linear, List 1, List 2, List 3 _
The same format can be used for the following types of graphs, by simply replacing “Linear”
in the above specifi cation with the applicable graph type.
Linear Regression: ........................Linear
Med-Med: ......................................Med-Med
Quadratic Regression: ...................Quad
Cubic Regression: .........................Cubic
Quartic Regression: .......................Quart
Logarithmic Regression: ................Log
Exponential Regression: ................Exp
Power Regression: .........................Power
8-6-10
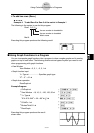
Using Calculator Functions in Programs
*
1
Outliers:On
S-Gph1 DrawOn, MedBox, List 1, 1, 1
Outliers:Off
S-Gph1 DrawOn, MedBox, List 1, 1, 0