


20070201
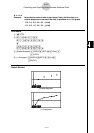
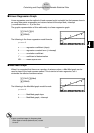
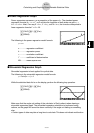
k Power Regression Graph
Power regression expresses y as a proportion of the power of x . The standard power
regression formula is
y = a × x
b
, so if we take the logarithm of both sides we get In y =
In a + b × In x . Next, if we say X = In x , Y = In y , and A = In a , the formula corresponds to
linear regression formula Y = A + b X.
1 (CALC)6 (g )4 (Pwr)
6 (DRAW)
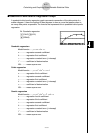
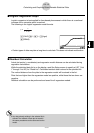
The following is the power regression model formula.
y = a · x
b
a ...............regression coeffi cient
b ...............regression power
r ............... correlation coeffi cient
r
2
.............coeffi cient of determination
MSe ........mean square error
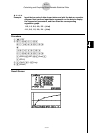
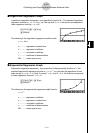
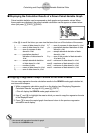
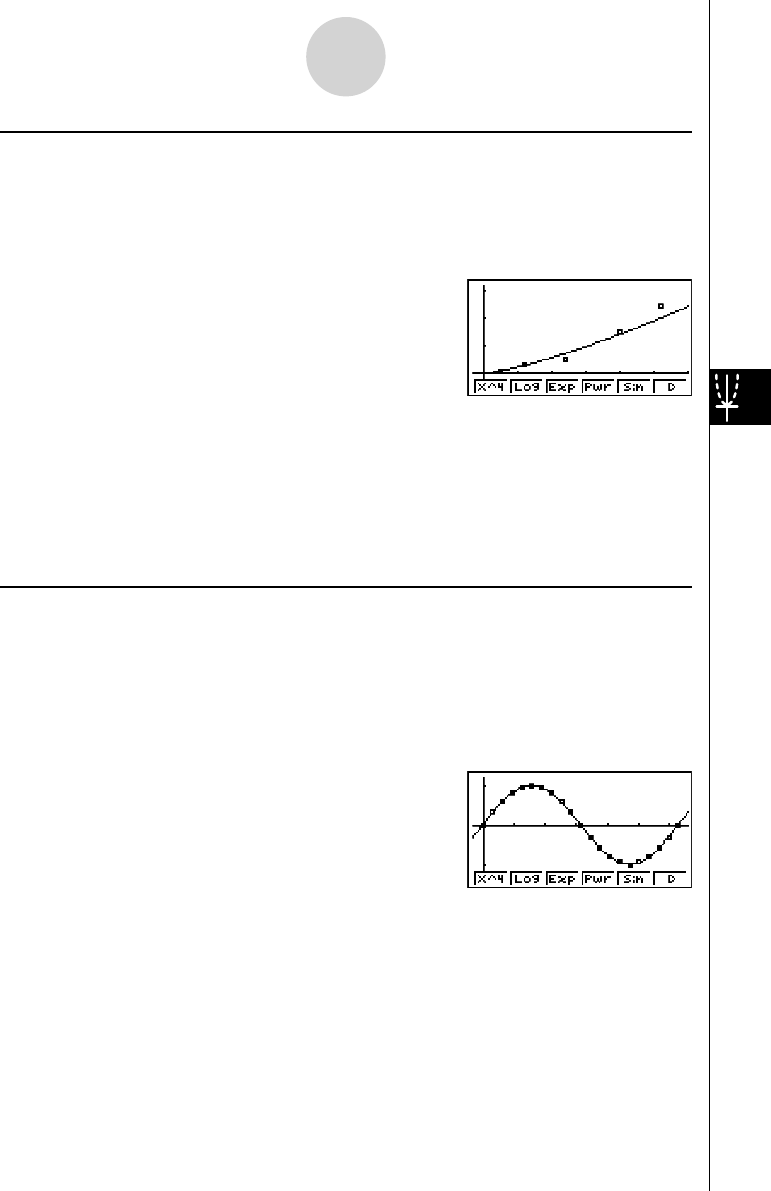
k Sinusoidal Regression Graph
Sinusoidal regression is best applied for cyclical data.
The following is the sinusoidal regression model formula.
y = a ·sin( bx + c ) + d
While the statistical data list is on the display, perform the following key operation.
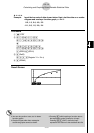
1 (CALC)6 (g )5 (Sin)
6 (DRAW)
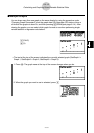
Make sure that the angle unit setting of the calculator is Rad (radians) when drawing a
sinusoidal regression graph. The sinusoidal regression calculation is performed using
radians, so the graph will cannot be drawn correctly if the angle unit setting is something
else.
• Certain types of data may take a long time to calculate. This does not indicate malfunction.
6-3-9
Calculating and Graphing Paired-Variable Statistical Data