


20070201
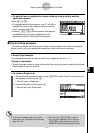
u To use copy and paste to draw a graph
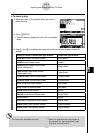
1. Perform steps 1 through 7 under “To create a
Graph strip” (page 10-3-13) to create a Graph strip
with the title “Graph draw”.
• After completing step 7, check to make sure
the Graph strip is highlighted on the eActivity
workspace screen. If it isn’t, use the f and c
cursor keys to move the highlighting to the Graph
strip.
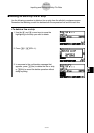
2. Press 3 (INS)1 (TEXT) to input a text line.
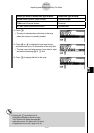
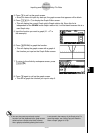
3. Enter the following expression into the text line: Y = X
2
– 1.
4. Use the f and c cursor keys to move the cursor to the expression you just input
(Y = X
2
– 1), and copy it to the clipboard.
• See “To specify the copy range” (page 1-3-5) for details about how to copy text to the
clipboard.
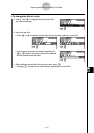
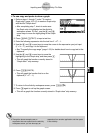
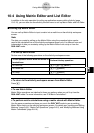
5. Use the f and c cursor keys to move the
highlighting to the Graph strip, and then press w .
• This will graph the function currently stored in
“Graph draw ” strip memory.
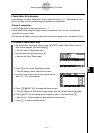
6. Press ! j (PASTE).
• This will graph the function that is on the
clipboard (Y = X
2
– 1).
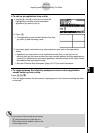
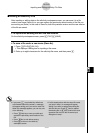
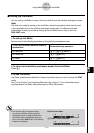
7. To return to the eActivity workspace screen, press ! a ( ' ).
8. Press w again to call up the graph screen.
• This will re-graph the function currently stored in “Graph draw” strip memory.
10-3-17
Inputting and Editing eActivity File Data
# Though the above example uses an
expression that was copied from the eActivity
workspace screen, you can also copy an
expression from another application and then paste
it into eActivity.