


20070201
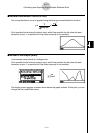
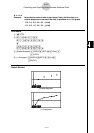
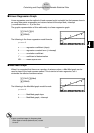
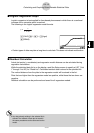
k Linear Regression Graph
Linear regression uses the method of least squares to plot a straight line that passes close to
as many data points as possible, and returns values for the slope and
y -intercept
( y -coordinate when x = 0) of the line.
The graphic representation of this relationship is a linear regression graph.
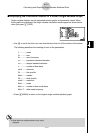
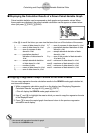
1 (CALC)2 (X)
6 (DRAW)
The following is the linear regression model formula.
y = ax + b
a ..............regression coeffi cient (slope)
b ..............regression constant term ( y -intercept)
r ..............correlation coeffi cient
r
2
.............coeffi cient of determination
MSe ........mean square error
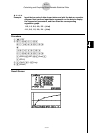
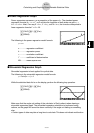
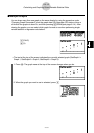
k Med-Med Graph
When it is suspected that there are a number of extreme values, a Med-Med graph can be
used in place of the least squares method. This is similar to linear regression, but it
minimizes the effects of extreme values.
1 (CALC)3 (Med)
6 (DRAW)
The following is the Med-Med graph model formula.
y = ax + b
a ...............Med-Med graph slope
b ...............Med-Med graph y -intercept
6-3-6
Calculating and Graphing Paired-Variable Statistical Data
# Input a positive integer for frequency data.
Other types of values (decimals, etc.) cause
an error.