


20070201
9-7-3
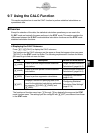
Using the CALC Function
k Executing a Statistical Calculation
The following shows an actual example of how to perform a statistical calculation in the
S
•
SHT mode.
u To execute a statistical calculation
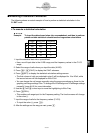
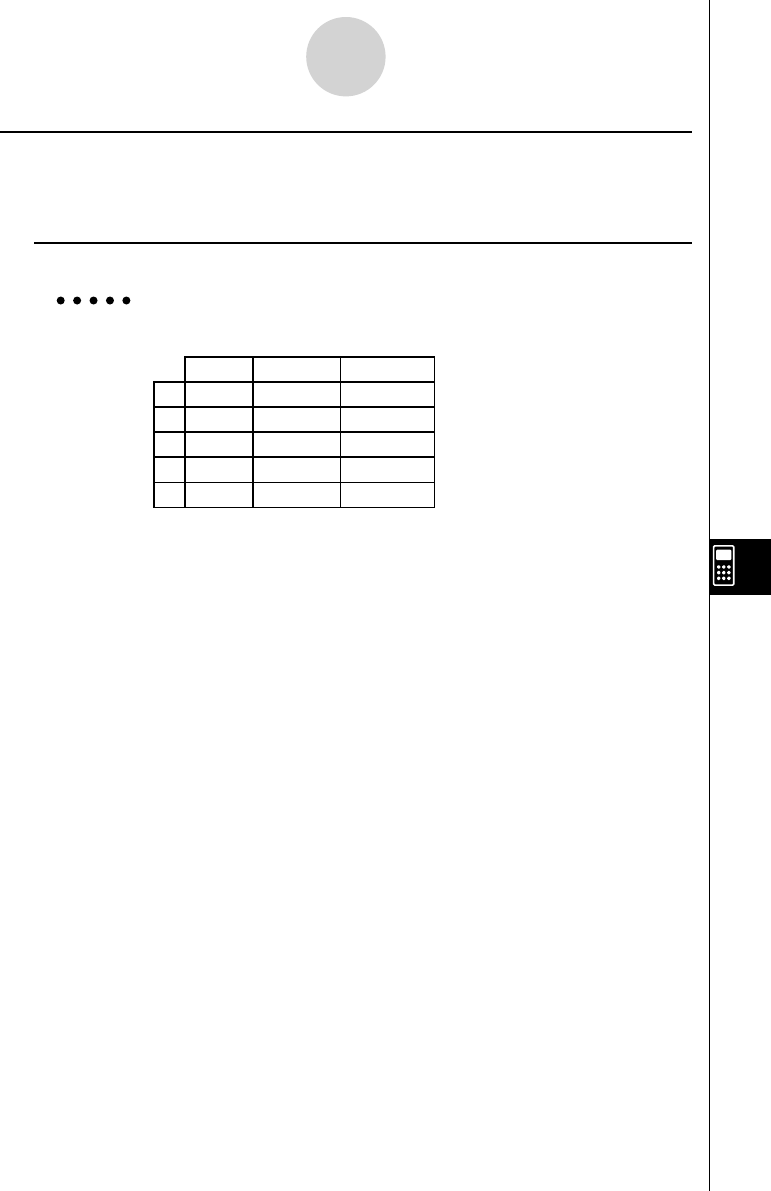
Example To input the data shown below into a spreadsheet, and then to perform
paired-variable statistical calculations and regression calculations
Height Shoe Size Frequency
A 155 23 1
B 165 25.5 2
C 180 27 2
D 185 28 1
E 170 25 3
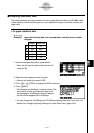
1. Input the statistical data into a spreadsheet.
• Here, we will input data in the A1:B5 range, and the frequency values in the C1:C5
range.
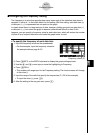
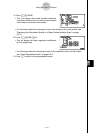
2. Select the range of cells where you input the data (A1:B5).
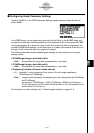
3. Press 6 (g )2 (CALC) to display the CALC submenu.
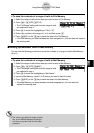
4. Press 6 (SET) to display the statistical calculation settings screen.
• The fi rst column of cells you selected in step 2 will be displayed for 1Var XCell, while
the second column will be displayed for 2Var YCell.
• You can change the cell ranges manually using the same procedures as those for the
graphing cell range settings. See “To change the XCellRange and YCellRange settings
manually” (page 9-6-5) for more information.
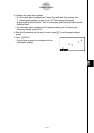
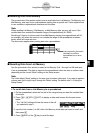
5. Use the f and c cursor keys to move the highlighting to 2Var Freq.
6. Press 2 (CELL).
• This enables cell range input for the Frequency setting. The function menu will change
to the colon (:).
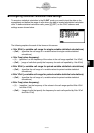
7. Input the range of cells for the frequency values (C1:C5).
• To input the colon (:), press 1 (:).
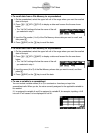
8. After the settings are the way you want, press w .