


20070201
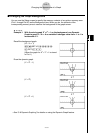
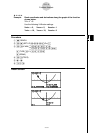
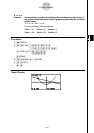
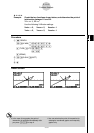
Example Use coordinate rounding and display the coordinates in the vicinity of
the points of intersection for the two graphs produced by the functions
shown below.
Y1 =
x
2
– 3, Y2 = – x + 2
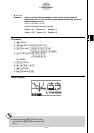
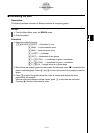
Use the following V-Window settings.
Xmin = –5, Xmax = 5, Xscale = 1
Ymin = –10, Ymax = 10, Yscale = 2
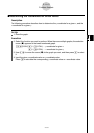
Procedure
1 m GRAPH
2 !3 (V-WIN) - f w f w b w c
- ba w ba w c wJ
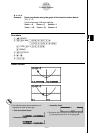
3 (TYPE)1 (Y=) vx -d w
-v +c w
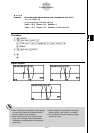
6 (DRAW)
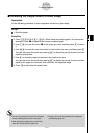
3 !2 (ZOOM)6 (g )3 (RND)
4 !1 (TRCE)
d ~d
Result Screen
5-11-8
Function Analysis