


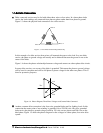
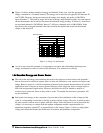
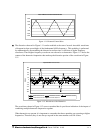

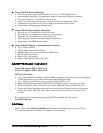
Figure 1.11: Distorted Current Wave
Q
The distortion observed in Figure 1.11 can be modeled as the sum of several sinusoidal waveforms
of frequencies that are multiples of the fundamental 60 Hz frequency. This modeling is performed
by mathematically disassembling the distorted waveform into a collection of higher frequency
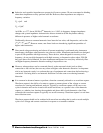
waveforms. These higher frequency waveforms are referred to as harmonics. Figure 1.12 shows the
content of the harmonic frequencies that make up the distortion portion of the waveform in Figure
1.11.
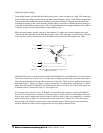
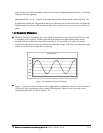
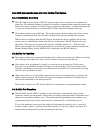
Figure 1.12: Waveforms of the Harmonics
The waveforms shown in Figure 1.12 are not smoothed but do provide an indication of the impact of
combining multiple harmonic frequencies together.
When harmonics are present it is important to remember that these quantities are operating at higher
frequencies. Therefore, they do not always respond in the same manner as 60 Hz values.
Electro Industries/GaugeTech
Doc # E107706 V1.25 1-11
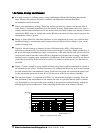
Total A Phase Current with Harmonics
-1500
-1000
-500
0
500
1000
1500
13365
Expanded Harmonic Currents
-250
-200
-150
-100
-50
0
50
100
150
200
250
1
3
5
7
9
11
13
15
17
19
21
23
25
27
29
31
33
35
37
39
Amps
2 Harmonic Current
3 Harmonic Current 5 Harmonic Current
7 Harmonic Current A Current Total Hrm