


3
3-56
Departmental Switch Models DS-16B and DS-8B Web Tools User Guide
Using Web Tools
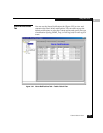
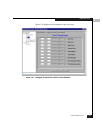
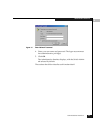
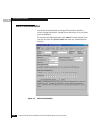
In addition to the port graphs, a graph for the entire switch is
provided at the bottom of the window. Resizing the window changes
the size and shape of all the individual graphs.
In both the port and switch graphs, the horizontal axis represents
elapsed time and the vertical axis represents throughput. By default
the port graph contains approximately 10 minutes worth of data and
the switch graph contains approximately 20 minutes of data.