104
Advanced Operations
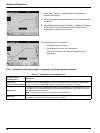
6.7.3.1 Navigation of a time scan or a time scan analysis
After a time scan has been completed, the time and the
absorbance/transmittance data are displayed as a curve.
Where the cursor is positioned on the curve, the elapsed time up to
this point and the corresponding absorbance are highlighted.
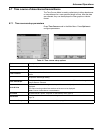
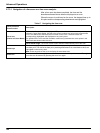
Table 17 Navigating the time scan
Cursor Function/
Zoom Function
Description
Curve Icon
(Choice of Cursor Mode)
Delta mode: A second cursor is highlighted. The position of the fixed cursor was previously
defined in Cursor Mode Single. Use the active cursor to select any point on the measurement
curve. The difference to the fixed cursor is shown on the curve. The delta values are
correspondingly highlighted and displayed on the x and y axes.
The gradient of the curve and the correlation coefficient (r
2
) between the cursor points in the
Delta mode are shown under the curve.
Cursor Mode Single: The cursor moves to each selected measurement point of the scan.
Arrow keys
The arrow keys (right/left) are used to move the cursor (depending on the selected mode) to the
next data point. The data of the data point (wavelength/absorbance or transmittance value) are
highlighted on the x and y axes.
Note: Press any point on the curve to display the associated data.
Zoom Icon
This function is used to magnify the section of the curve in the vicinity of the cursor. The original
curve size can be restored by pressing the zoom icon again.


