


94
Advanced Operations
6.6 Wavelength Scan mode – recording of absorbance and transmittance
spectrums
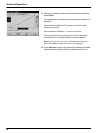
In the wavelength scan mode, the absorbance of the light in a
solution over a defined wavelength spectrum is measured.
The measurement results can be displayed as a curve, as percent
transmittance (%T) or as absorbance (Abs). The collected data can
be printed as a table or a curve.
The data are available for formatting changes. These include
automatic scaling and zoom functions. Maximum and minimum
values are determined and shown as a table.
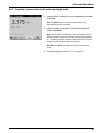
The cursor can be moved to any point on the curve for the purpose
of reading off the absorbance or transmittance value and the
wavelength. The data associated with each data point can also be
shown as a table.
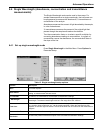
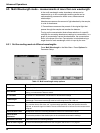
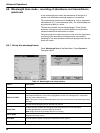
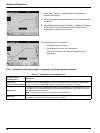
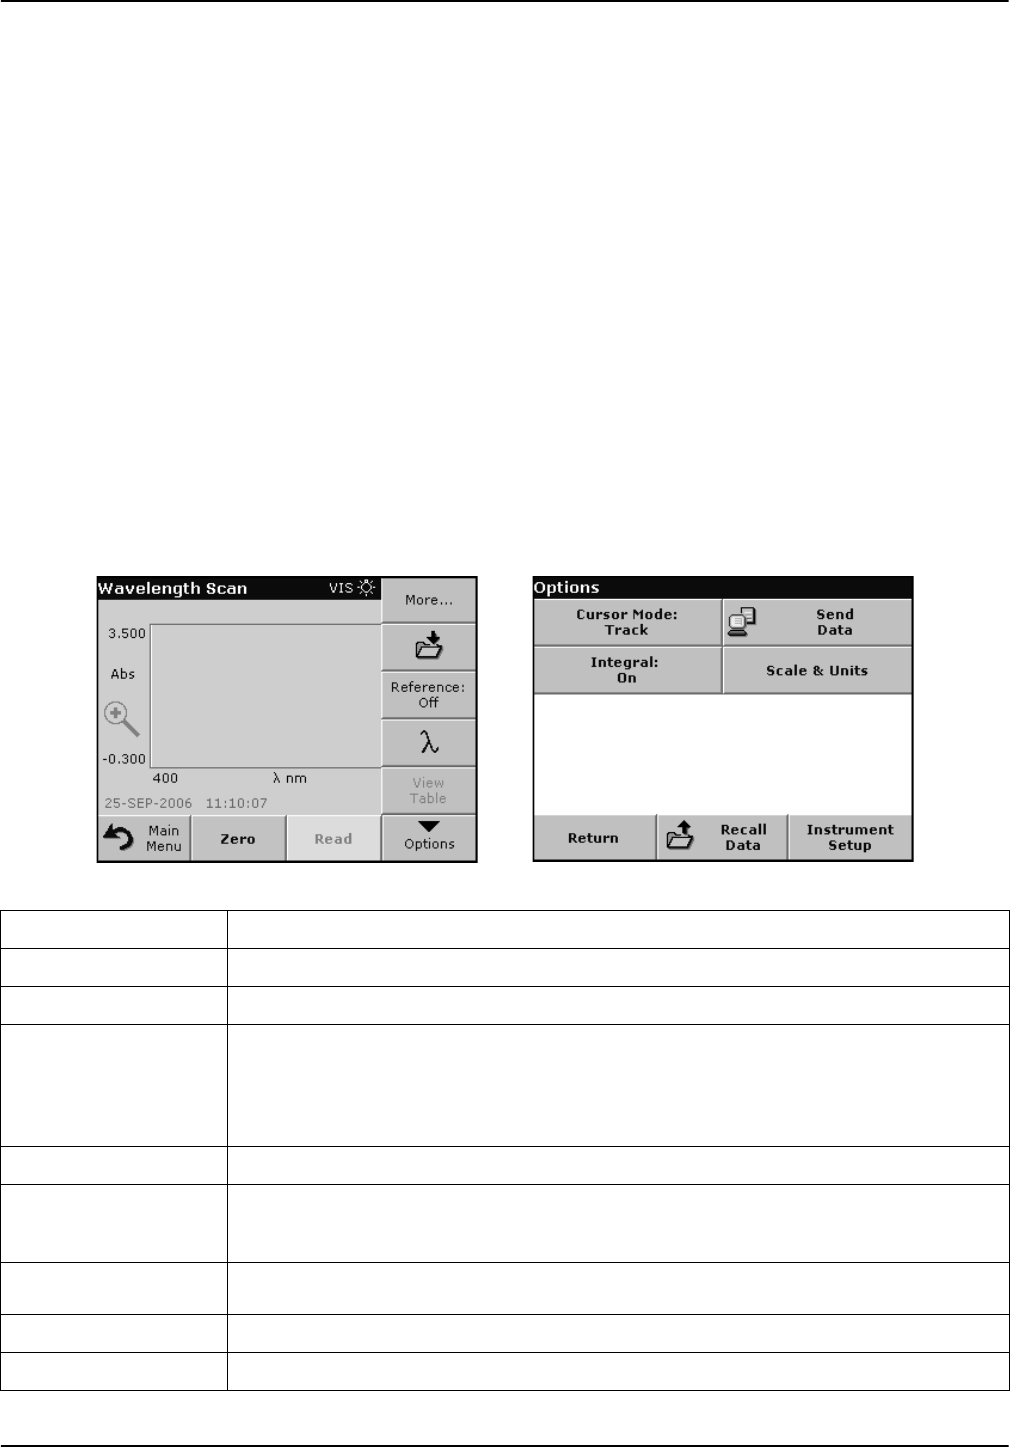
6.6.1 Set up the wavelength scan
Press Wavelength Scan in the Main Menu. Press Options for
Parameter Setup.
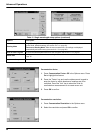
Table 14 Wavelength scan setup options
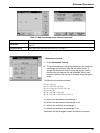
Option Description
More For further Options
Store icon To store the scan data
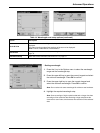
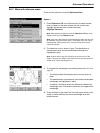
Reference Off/On
From the displayed list of stored scans, a record is selected for use as a reference
scan/superimposed scan. This can be highlighted or shown in the background in comparison
with the actual measured scan.
Note: This option is only available when there are stored scans with the same wavelength range
and step.
λ To enter the wavelength spectrum and the scan interval
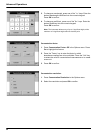
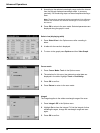
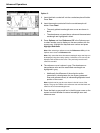
Select View
Enables the user to switch the display back and forth between the scan data tables
(wavelength/absorbance) and the graph of the curve.
Note: Select View will be activated after the first reading.
Cursor Mode
To select Track or Peak/Valley. The selection for this menu item determines to which points on
the graph the cursor moves.
Send Data To send Data to a printer, computer or USB memory stick (Type A)
Integral: On/Off The integral gives the area and the derivative of the integral gives the original function