


Statistics aplet 8-17
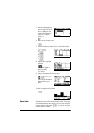
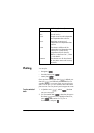
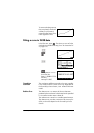
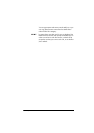
To connect the data points as
they are plotted, checkmark
CONNECT in the second
page of the Plot Setup. This is
not a regression curve.
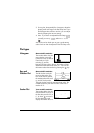
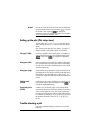
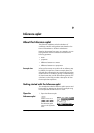
Fitting a curve to 2VAR data
In the Plot view, press . This draws a curve to fit the
checked two-variable data set(s). See “To choose the fit”
on page 8-12.
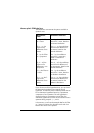
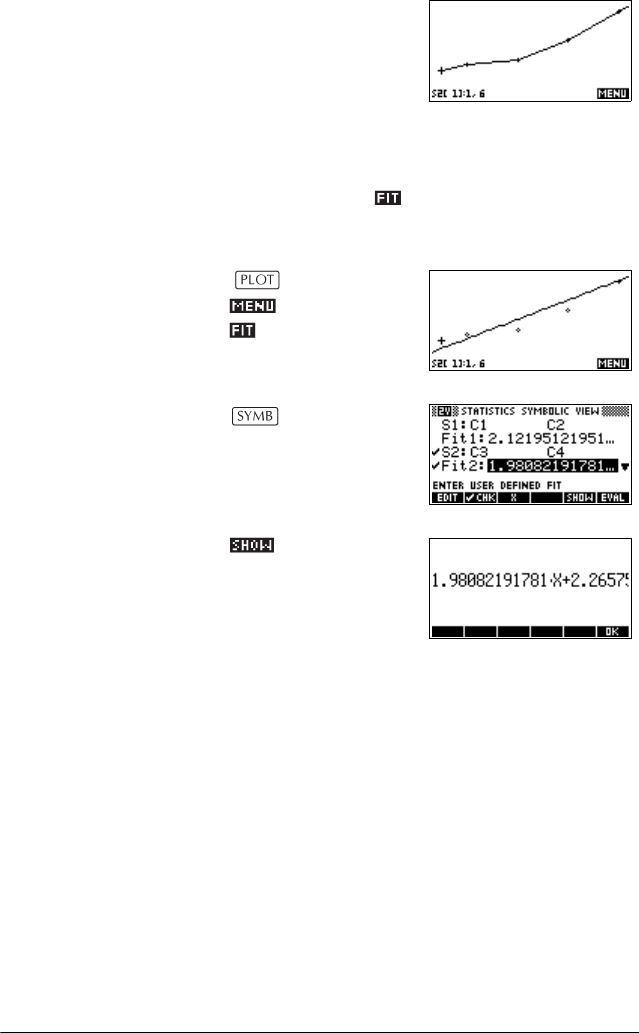
The expression in Fit2
shows that the
slope=1.98082191781
and the y-
intercept =2.2657.
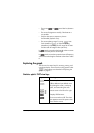
Correlation
coefficient
The correlation coefficient is stored in the CORR variable.
It is a measure of fit to a linear curve only. Regardless of
the Fit model you have chosen, CORR relates to the linear
model.
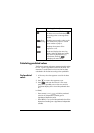
Relative Error The relative error is a measure of the error between
predicted values and actual values based on the specified
Fit. A smaller number means a better fit.
The relative error is stored in a variable named RELERR.
The relative error provides a measure of fit accuracy for
all fits, and it does depend on the Fit model you have
chosen.