


9-4 Inference aplet
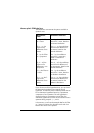
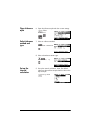
By default, each field already contains a value.
These values constitute the example database and
are explained in the feature of this aplet.
Display on-line
help
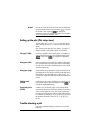
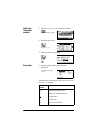
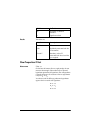
6. To display the on-line
help, press
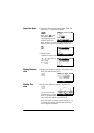
7. To close the on-line help,
press .
Display test
results in
numeric format
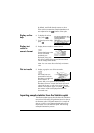
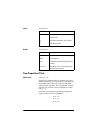
8. Display the test results in numeric format.
The test distribution value
and its associated
probability are
displayed, along with
the critical value(s) of the test and the associated
critical value(s) of the statistic.
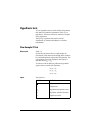
Note: You can access the on-line help in Numeric
view.
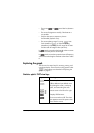
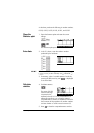
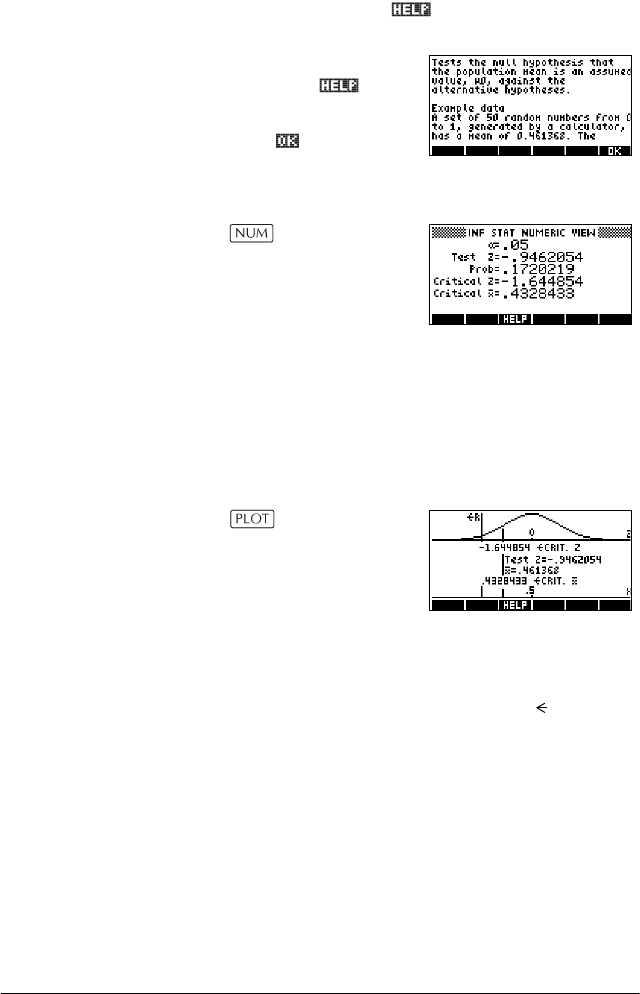
Plot test results 9. Display a graphic view of the test results.
Horizontal axes are
presented for both the
distribution variable and
the test statistic. A
generic bell curve represents the probability
distribution function. Vertical lines mark the critical
value(s) of the test, as well as the value of the test
statistic. The rejection region is marked and the
test numeric results are displayed between the
horizontal axes.
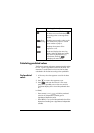
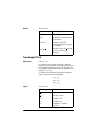
Importing sample statistics from the Statistics aplet
The Inference aplet supports the calculation of confidence
intervals and the testing of hypotheses based on data in
the Statistics aplet. Computed statistics for a sample of
data in a column in any Statistics-based aplet can be
imported for use in the Inference aplet. The following
example illustrates the process.
R