


Statistics aplet 8-19
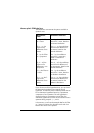
• The correct or menu label on (Numeric
view).
• The correct fit (regression model), if the data set is
two-variable.
• Only the data sets to compute or plot are
checkmarked (Symbolic view).
• The correct plotting range. Try using Auto
Scale (instead of ), or adjust the plotting
parameters (in Plot Setup) for the ranges of the axes
and the width of histogram bars (HWIDTH).
In mode, ensure that both paired columns contain
data, and that they are the same length.
In mode, ensure that a paired column of frequency
values is the same length as the data column that it refers
to.
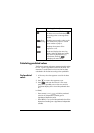
Exploring the graph
The Plot view has menu keys for zooming, tracing, and
coordinate display. There are also scaling options under
. These options are described in“Exploring the
graph” on page 2-7.
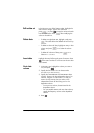
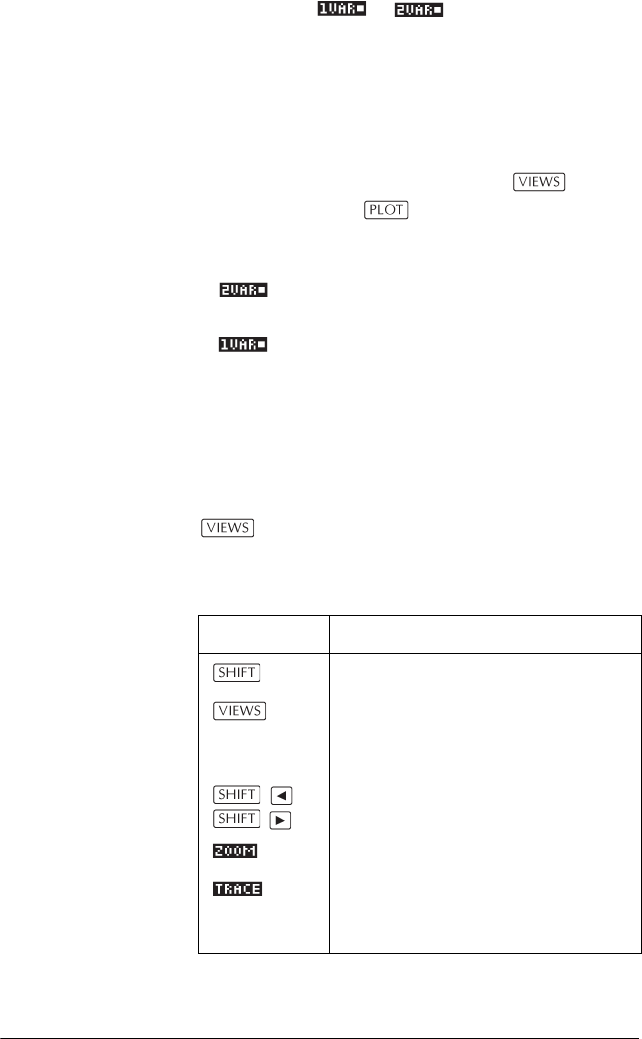
Statistics aplet’s PLOT view keys
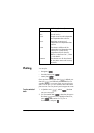
Key Meaning
CLEAR Erases the plot.
Offers additional pre-defined views
for splitting the screen, overlaying
plots, and autoscaling the axes.
Moves cursor to far left or far right.
Displays ZOOM menu.
Turns trace mode on/off. The white
box appears next to the option when
Trace mode is active.