


100
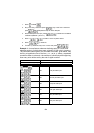
5. Press to obtain B.
6. Press 1 to obtain the effective growth rate (as a decimal).
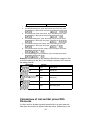
7. To make a y-estimate, key in the x-value and press .
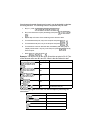
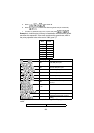
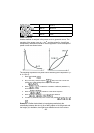
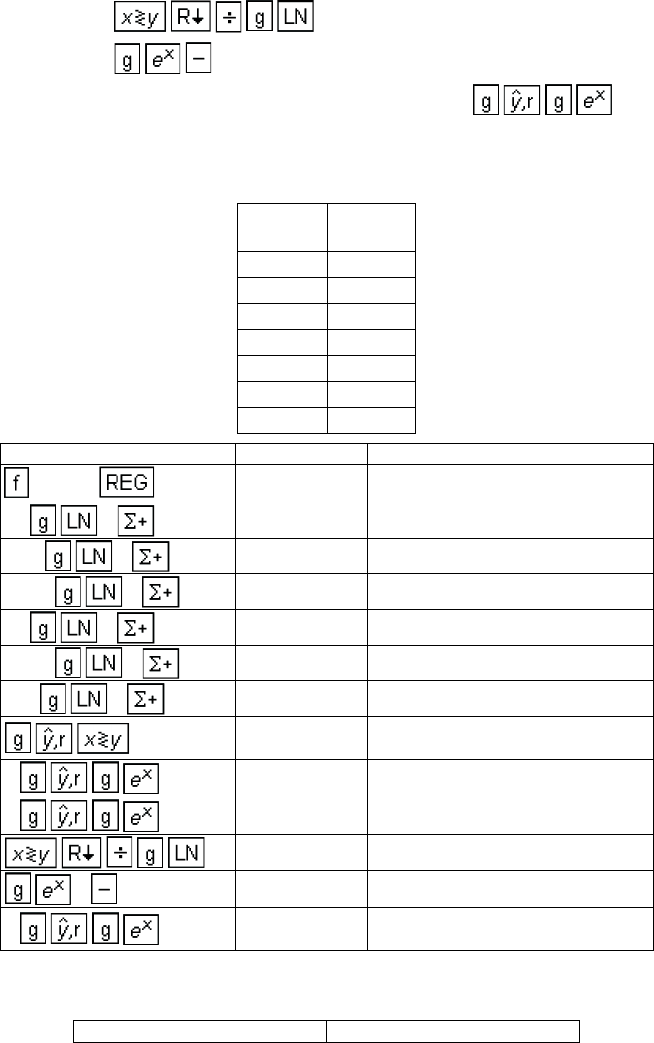
Example 1: A stock's price in history is listed below. What effective growth
rate does this represent? If the stock continues this growth rate, what is
the price projected to be at the end of 1982 (year 7)?
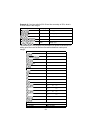
For repeated use of this routine, the following HP-12C program will be
useful.
End of
Year
Price
1976(1) 45
1977(2) 51.5
1978(3) 53.75
1979(4) 80
1980(5) 122.5
1981(6) 210
1982(7) ?
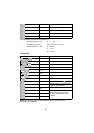
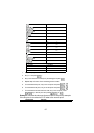
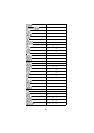
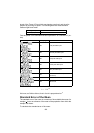
Keystrokes Display
CLEAR
45 1
1.00 First data pair input.
51.5 2
2.00 Second data pair input.
53.75 2
3.00 Third data pair input.
80 2
4.00 Fourth data pair input.
122.5 2
5.00 Fifth data pair input.
210 2
6.00 Sixth data pair input.
0.95
Correlation coefficient (between ln
y and x).
1
0
27.34 A
0.31 B
1
0.36 Effective growth rate.
7
232.35
Projected price at end of year 7
(1982).
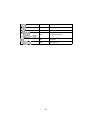
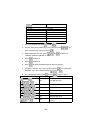
KEYSTROKES DISPLAY