


To interleave trace lists
1 Set up the analyzers whose data you wish to interleave as part of a
group run.
You won’t need to do this if the two measurement modules for which you
want mixed display are really part of the same module. For example, you
might have an HP 16550A state/timing analyzer configured as two separate
analyzers, one a state analyzer, the other a timing analyzer. You can use
mixed display to view the timing analyzer waveform with the trace lists from
the state analyzer.
2
Select the first state analyzer whose trace list will be shown in the
interleaved display.
3 Select Trigger from the menu field and set Count to Time.
The system uses the time stamps stored with each state to determine the
ordering of states shown in an interleaved trace list.
4
Repeat steps 2 and 3 for the second state analyzer.
5 Select Listing Display from the Menu field.
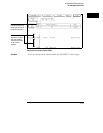
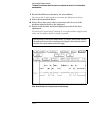
6 Select one of the label fields in the trace list display, then select
Interleave.
7 Select the name of the analyzer whose trace list will be interleaved
with the first analyzer. Then choose the label that you want to
interleave from the selected analyzer.
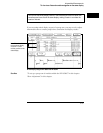
Interleaved data is displayed in yellow. Trace list line numbers of interleaved
data are indented. The labels identifying the interleaved data are shown
above the labels for the current analyzer, and are displayed in yellow.
If you have problems with the procedure, and you are using two independent
analyzers, first ensure that the analyzers are set up as part of a group run.
Ensure that each analyzer is set to Count Time and that each analyzer has an
independent clock from the target system.
You can interleave trace lists from state analyzers that were configured as part
of a group run or from state analyzers that are configured as separate analyzers
within the same measurement module. In the first case, you might have two
HP 16550A analyzers configured in a group run; in the second, you might have a
single HP 16550A configured as two state analyzers. The interleaved trace lists
are shown as a time-correlated, state-to-state display.
Intermodule Measurements
To interleave trace lists
2–22