


10: Running Total and Statistics 133
File name : 17BII-Plus-Manual-E-PRINT-030709 Print data : 2003/7/11
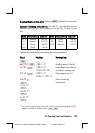
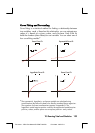
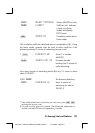
Curve Fitting and Forecasting
Curve fitting is a statistical method for finding a relationship between
two variables, x and y. Based on this relationship, you can estimate new
values of y based on a given x-value, and vice-versa. Each SUM list
holds the numbers (data values) for one variable. You can select one of
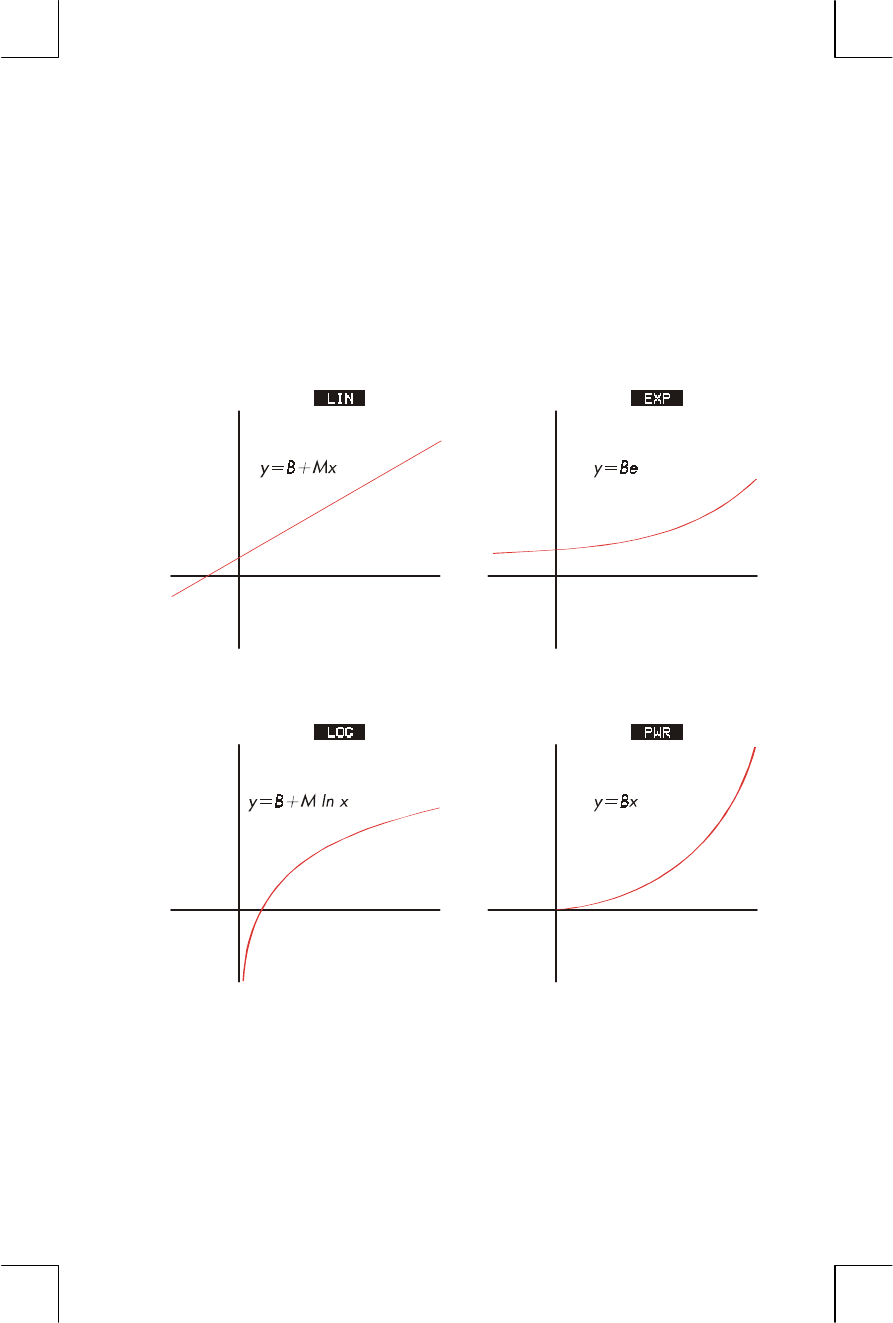
four curve-fitting models:
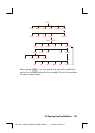
*
Linear Curve Fit
Lo
g
arithmic Curve Fit
Ex
p
onential Curve Fit
Power Curve Fit
y
y
y
y
x
x
x
x
Mx
M
*
The exponential, logarithmic, and power models are calculated using
transformations that allow the data to be fitted by standard linear regression.
The equations for these transformations appear in appendix B. The
logarithmic model requires positive x-values; the exponential model requires
positive y-values; and the power curve requires positive x- and y-values.