


LaserSpeed 8000-3 Instruction Handbook
LaserTrak Software
Part No. 93463 / Drawing No. 0921-01561 Page 117 of 221 Revision A (Sep 2007)
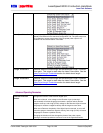
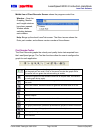
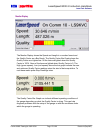
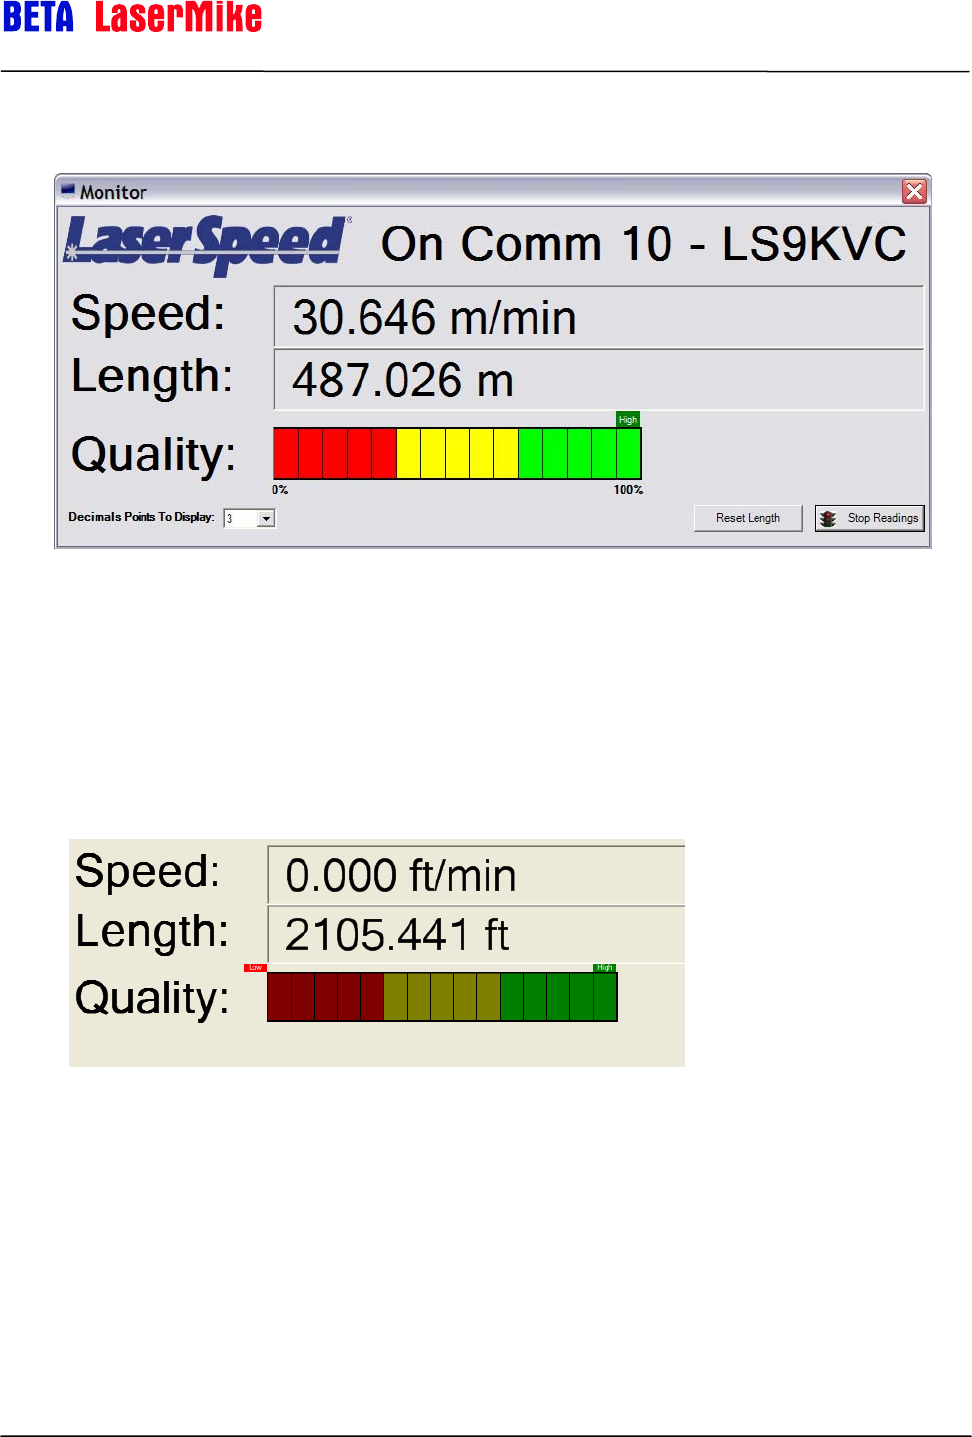
Monitor Display
The Monitor Display shows the Speed and Length in a number format and
the Quality Factor as a Bar Graph. The Quality Factor Bar Graph shows the
Quality Factor as a lighted bar. All the bars are lighted when the Quality
Factor is 100%. None of the bars are lighted when Quality Factor is 0. The
High (green square), Low (red square) above the bar graph indicate the max
and minimum Quality Factor readings since the start of data acquisition. To
rest these marks press Stop Readings twice.
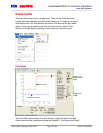
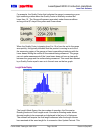
The Quality Factor Bar Graph can indicate different operating conditions of
the gauge depending on what the Quality Factor is doing. This can help
diagnose problems with the setup of the gauge or with the conditions under
which the gauge is operating.