7. Operation and Maintenance
9128-A2-GB20-80 September 2002
7-69
Trap Event Log
The Trap Event Log displays all traps stored in the SNMP trap event log. The
following log example describes the alarm conditions that will generate an SNMP
trap for a physical interface, and for the frame relay LMIs and DLCIs. These alarm
conditions also generate Health and Status messages seen on the
Health and
Status Messages
on page 7-20.
Main Menu
→
Status
→
Trap Event Log
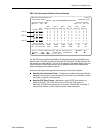
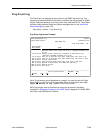
Trap Event Log Screen Example
Up to 12 trap events can be displayed on a screen, the most current first. Page
down (PgD
n) to view less current trap events. When no trap events have been
logged,
No Events in Log.
appears in the Event column.
ASCII trap strings used to describe trap events are provided in the tables
contained in
Standards Compliance for SNMP Traps
in Appendix B,
SNMP MIBs
and Traps, and RMON Alarm Defaults
.
main/status/event_log 9128-II
Device Name: Node A 5/26/2000 23:32
TRAP EVENT LOG
Total Trap Events: 535
Time Elapsed
Since Event Event
0d 23:59:59 Change in Frames Discarded due to Inbound Resource Errors on Sync
Data Port S01P1 frame relay link “Port-1" exceeded threshold of 1
by 105.
2d 23:59:59 Change in Total LMI Errors on Network T1 frame relay link
“Net1-FR1" exceeded threshold of 1 by 59.
6d 23:59:59 DLCI 101 of Sync Data Port S01P1 frame relay link “Port-1" up.
10d 23:59:59 DLCI 101 of Sync Data Port S01P1 frame relay link “Port-1" down.
20d 23:59:59 Primary clock failed.
56d 23:59:59 Sync Data Port S01P1 frame relay link “Port-1" LMI down.
64d 23:59:59 Network T1 frame relay link “Net1-FR1" LMI down.
122d 23:59:59 Network T1 down.
364d 23:59:59 Unit reset.
--------------------------------------------------------------------------------
ESC for previous menu M
ainMenu Exit
R
efresh PgUp PgDn


