


52Sheet
GraphsGraphs
GraphsGraphs
Graphs
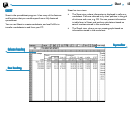
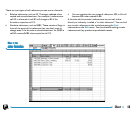
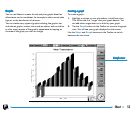
You can use Sheet to create, format and print graphs based on
information on the worksheet, for example to show annual sales
figures, or the distribution of revenue.
You can create many types of graphs including line graphs, bar
and column graphs, scatter charts and pie charts, and can add to
or alter many aspects of the graph’s appearance by tapping on
the area of the graph you wish to change.
Creating a graphCreating a graph
Creating a graphCreating a graph
Creating a graph
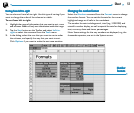
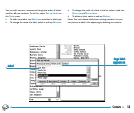
To create a graph:
1. Highlight a column or row of numbers in the Sheet view.
This will be the first “range” that your graph depicts. You
can add other ranges later on to build up your graph.
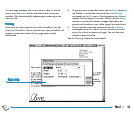
2. Tap the Graph button on the Toolbar to move to the graph
view.You will see your graph displayed on the screen.
Use the Sheet and Graph buttons on the Toolbar to switch
between the two views.
Graph viewGraph view
Graph viewGraph view
Graph view