


and SD-lo/l5 plotting the output, you can come up with some
terrific business graphs, charts, and mathematical function plots.
L-.
L., ‘-
The best way to do this is to set up an array in memory. This
is your “graph paper.”
The first thing to do is to determine how
big you want your output to be; this will determine the size of
your array. (If you have grandiose plans to till an entire page
with plotter output, you better have lots of memory in your
computer. With 60 dots per inch horizontally and 72 dots per
inch vertically, it takes at least 540 bytes of memory for each
square inch of plotted area. That doesn’t sound so bad-but an
area 8 inches square requires over 32K!)
Your array should be two-dimensional (just like graph paper)
where one dimension will be the number of columns of dots and
the other dimension is the number of printing lines (remember
that you can have up to eight rows of dots per printed line).
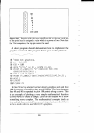
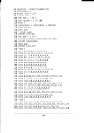
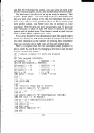
Here’s a program that will use calculated-shape graphics to
plot a circle. As you’ll see, by changing a few lines it can be used
to plot virtually any shape.
10
' General purpose for plotting program
20 ’
30 'Set program constants.
40 MAXCOL% = 75
: MAXROW% = 14
54) DIM BIT%(MAXCOL%, MAXROW%)
k
60 MASK%(l) = 64
: MASK%(4) = 8
70 MASK%(2) = 32
: MASK%(5) = 4
80 MASK%(3) = 16
: MASK%(6) = 2
90 LX = 20
: LY = 24)
100 LXFAC = 72/LX : LYFAC = 87lLY
110 '
120 'Plot curve.
130 GOSUB 600
144) '
*.
150 'Send bit image map to printer.
160 LPRINT CHR$(27) "A" CHRS(6)
c
170 FOR ROW% = $! TO MAXROW%
180 A$ = ""
190 LPRINT CHR$(27) "K" CHR$(MAXCOL%) CHR$(@);
L..
(I-.
t
209, FOR COL% = 1 TO MAXCOL%
2141 A$ = A$ + CHR$(BIT%(COL%,ROW%>)
220 NEXT COL%
230 LPRINT A$ " "
244) NEXT ROW%
250 LPRINT CHR$(27) "2"
L
260 END
111