


Activities 55
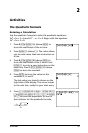
Zooming In on the Graph
To help identify maximums, minimums, roots, and intersections of
functions, you can magnify the viewing window at a specific location
using the
ZOOM instructions.
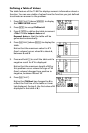
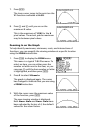
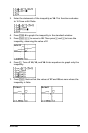
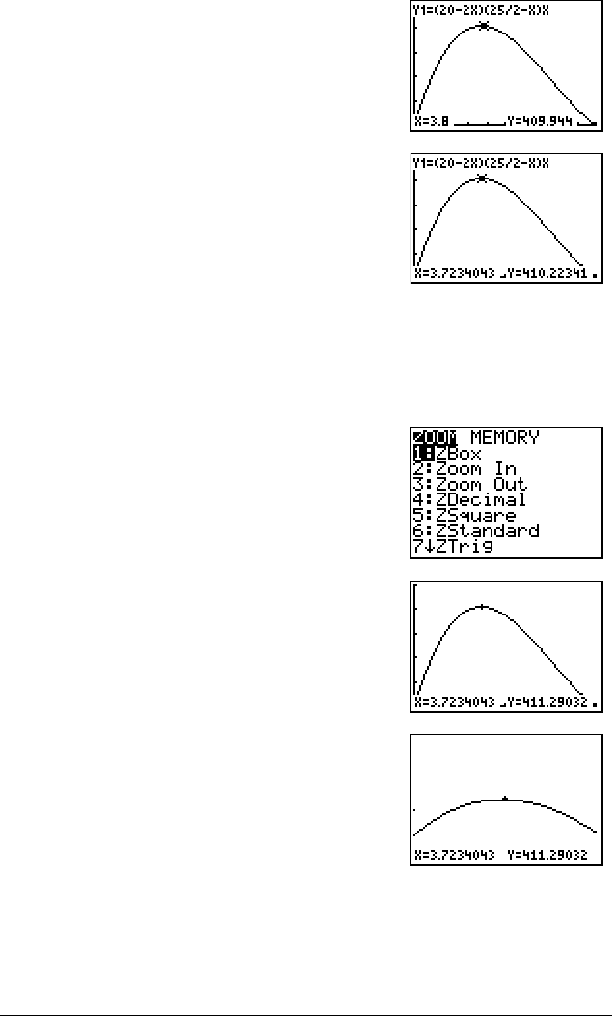
7. Press Í.
The trace cursor jumps to the point on the
Y1 function evaluated at X=3.8.
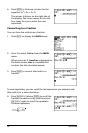
8. Press | and ~ until you are on the
maximum Y value.
This is the maximum of
Y1(X) for the X
pixel values. The actual, precise maximum
may lie between pixel values.
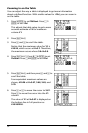
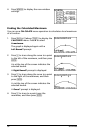
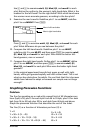
1. Press q to display the ZOOM menu.
This menu is a typical TI-84 Plus menu. To
select an item, you can either press the
number or letter next to the item, or you
can press † until the item number or letter
is highlighted, and then press Í.
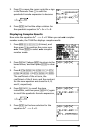
2. Press
2 to select 2:Zoom In.
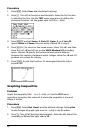
The graph is displayed again. The cursor
has changed to indicate that you are using
a ZOOM instruction.
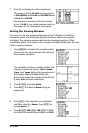
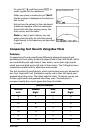
3. With the cursor near the maximum value
of the function, press Í.
The new viewing window is displayed.
Both XmaxNXmin and YmaxNYmin have
been adjusted by factors of 4, the default
values for the zoom factors.