


Activities 59
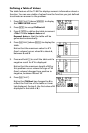
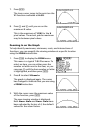
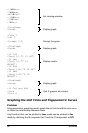
Use | and ~ to examine minX, Q1, Med, Q3, and maxX for each
plot. Notice the outlier to the women’s right-hand data. What is the
median for the left hand? For the right hand? With which hand were
the women more accurate guessers, according to the box plots?
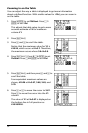
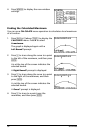
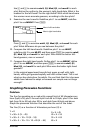
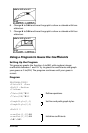
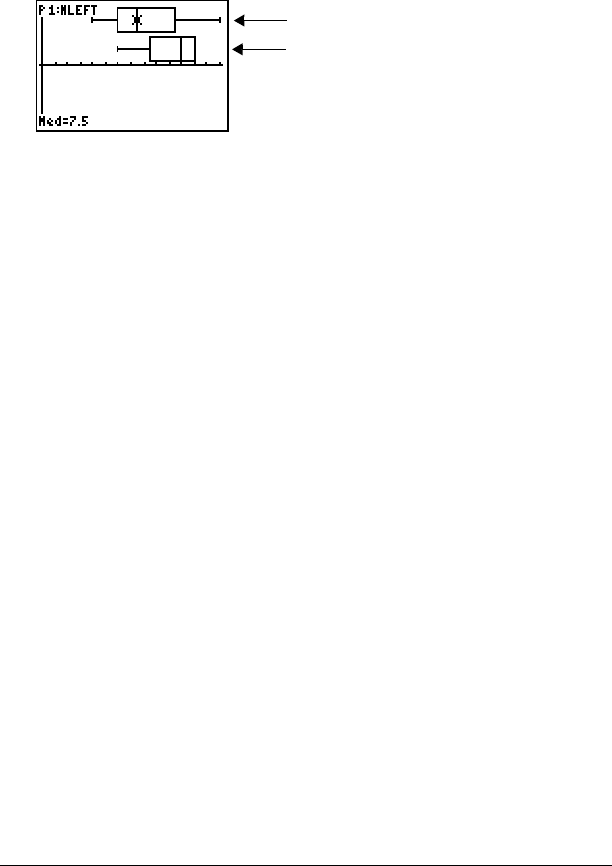
9. Examine the men’s results. Redefine plot 1 to use
MLEFT, redefine
plot 2 to use MRGHT. Press r.
Press | and ~ to examine minX, Q1, Med, Q3, and maxX for each
plot. What difference do you see between the plots?
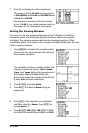
10. Compare the left-hand results. Redefine plot 1 to use WLEFT,
redefine plot 2 to use MLEFT, and then press r to examine minX,
Q1, Med, Q3, and maxX for each plot. Who were the better left-
hand guessers, men or women?
11. Compare the right-hand results. Define plot 1 to use WRGHT, define
plot 2 to use
MRGHT, and then press r to examine minX, Q1,
Med, Q3, and maxX for each plot. Who were the better right-hand
guessers?
In the original experiment boys did not guess as well with right
hands, while girls guessed equally well with either hand. This is not
what our box plots show for adults. Do you think that this is because
adults have learned to adapt or because our sample was not large
enough?
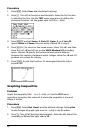
Graphing Piecewise Functions
Problem
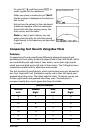
The fine for speeding on a road with a speed limit of 45 kilometers per
hour (kph) is 50; plus 5 for each kph from 46 to 55 kph; plus 10 for each
kph from 56 to 65 kph; plus 20 for each kph from 66 kph and above.
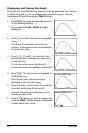
Graph the piecewise function that describes the cost of the ticket.
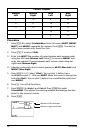
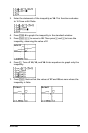
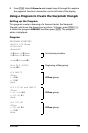
The fine (Y) as a function of kilometers per hour (X) is:
Y = 0
Y = 50 + 5 (X
N 45)
Y = 50 + 5
… 10 + 10 (X N 55)
Y = 50 + 5
… 10 + 10 … 10 + 20 (X N 65)
0 < X
45
45 < X
55
55 < X
65
65 < X
Men’s left-hand data
Men’s right-hand data