


66 Activities
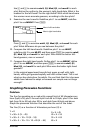
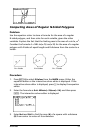
Graphing the Unit Circle and Trigonometric Curves
Problem
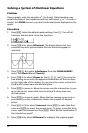
Using parametric graphing mode, graph the unit circle and the sine curve
to show the relationship between them.
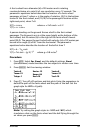
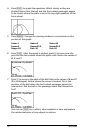
Any function that can be plotted in
Func mode can be plotted in Par
mode by defining the X component as T and the Y component as F(T).
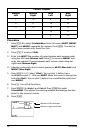
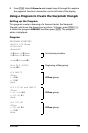
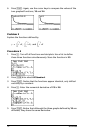
:L2p!Xmin
:2p!Xmax
:pà2!Xscl
:L10!Ymin
:10!Ymax
:1!Yscl
Set viewing window.
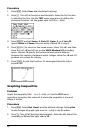
:DispGraph
:Pause
Display graph.
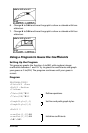
:FnOn 2
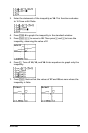
:Lbl Z
:Prompt C,D
Prompt for guess.
:DispGraph
:Pause
Display graph.
:If C=A
:Text(1,1,"C IS OK")
:If CƒA
:Text(1,1,"C IS
WRONG")
:If D=B
:Text(1,50,"D IS OK")
:If DƒB
:Text(1,50,"D IS
WRONG")
Display results.
:DispGraph
:Pause
Display graph.
:If C=A and D=B
:Stop
:Goto Z
Quit if guesses are correct.