


™
© 2012 Texas Instruments Educaon Technology Page 45
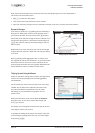
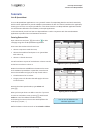
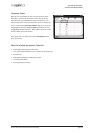
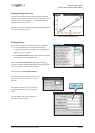
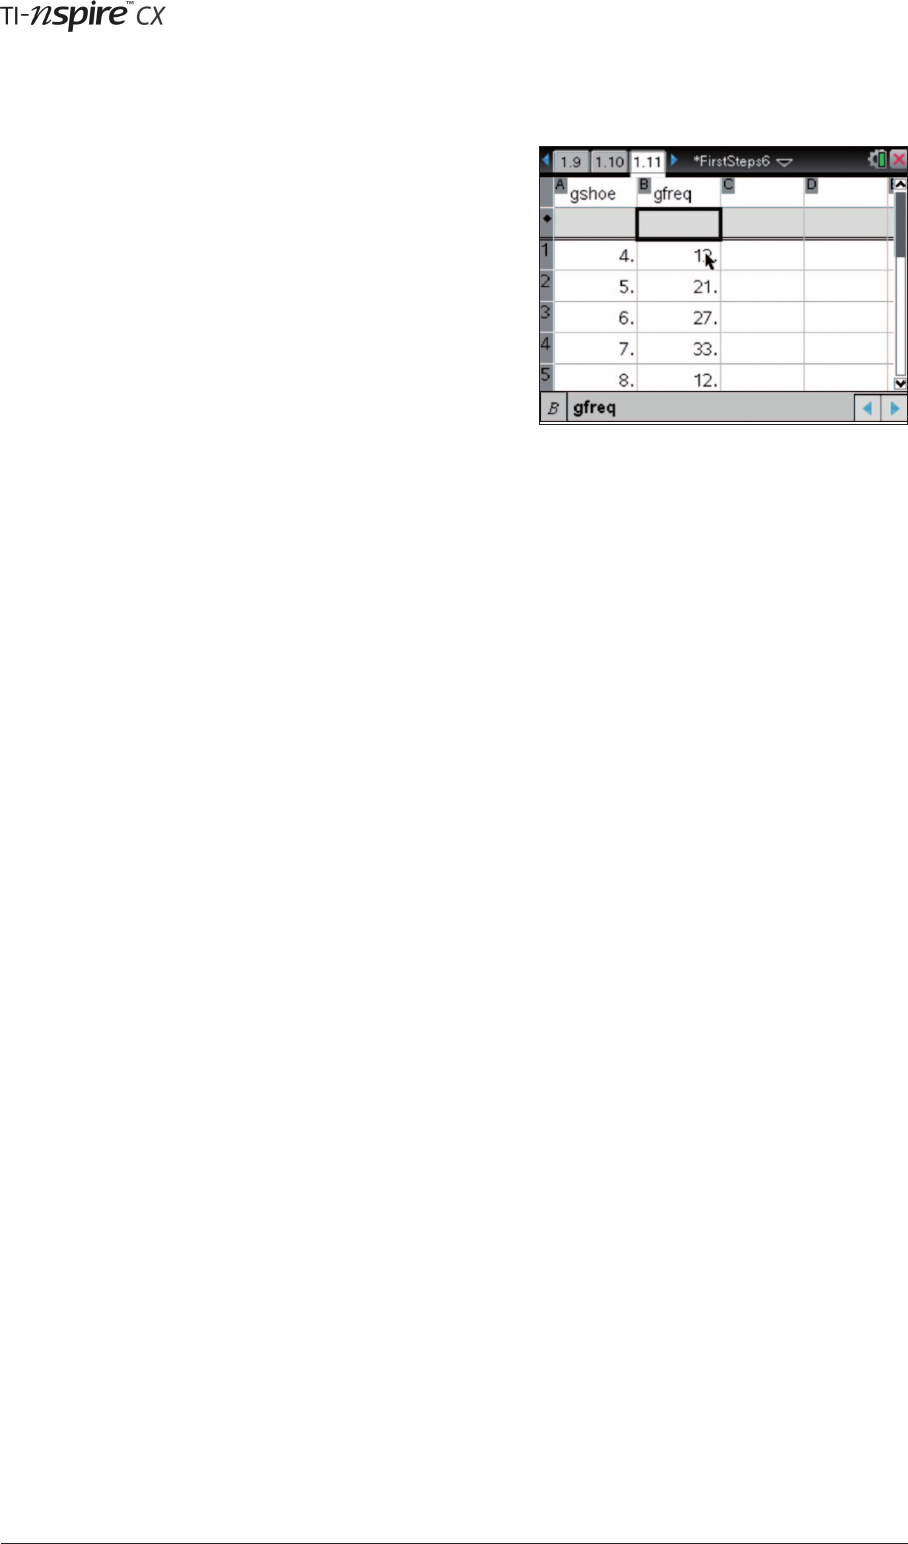
Oen due to the quanty of data it is more useful to work
with data in the form of a frequency chart, this can be for
either discrete or grouped data (using the midpoint). Let’s
look at some more shoe size data but this me as a frequency
chart. Create a new page, then enter the
following data, with the headings (grouped shoe size)
and (grouped frequency). We’ll explore what we can do
with this data in the next secon!
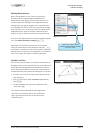
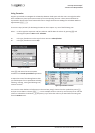
Once again save your document, now as before
going any further.
• Entering and eding data and formulas
• Lists and funcons dened in other secons of the document
• Resizing cells
• Coping with ambiguous variable/cell names
• Use of funcon tables
• Entering Frequency Tables