


™
© 2012 Texas Instruments Educaon Technology Page 47
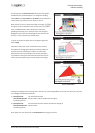
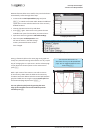
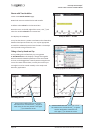
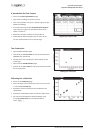
Upper quarle displayed
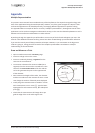
Comparing shoe sizes
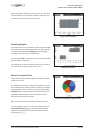
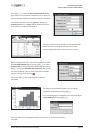
A Pie Chart displaying categorical data
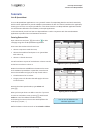
Display the boxplot and then move the cursor over the chart.
You will be able to see the median, quarles, maximum and
minimum values and, possibly, outlier values.
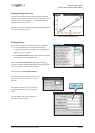
This boxplot can be compared with a similar one represenng
the female shoe sizes by displaying them, one above another.
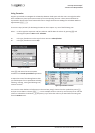
To do this we add a second by pressing b24,
this will give you the choice of available lists.
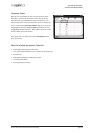
This me select . The result is two side by side box plots
that can easily be compared.
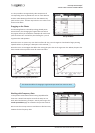
This method can be used to add more box plots, up to ve or
six can be easily compared on the same screen.
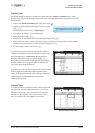
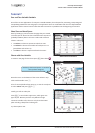
Create a new Data & Stascs page and choose the variable
mshoe for the x axis.
This variable contains a list of numerical data but they could
also be thought of as categorical data, in which case it would
be appropriate to use a Pie Chart. By using the opon
in the Plot Properes menu you can force the
handheld to treat the data in this way. Noce the way in
which the labels on the axis change.
Now you can use the Plot Type menu to choose Pie Chart.
It is also possible to enter non-numerical categorical data in
a page, e.g., favourite pets, sandwich
llings etc. Such data must be entered in quotaon marks
by pressing /r(Ó).