™
Page 50 © 2012 Texas Instruments Educaon Technology
It is also possible to arrange side-by-side comparisons of
corresponding summary stascs for two or more data sets
and this makes drawing inferences from the stascs very
quick and very clear. The best way to do this is to select more
than one list above.
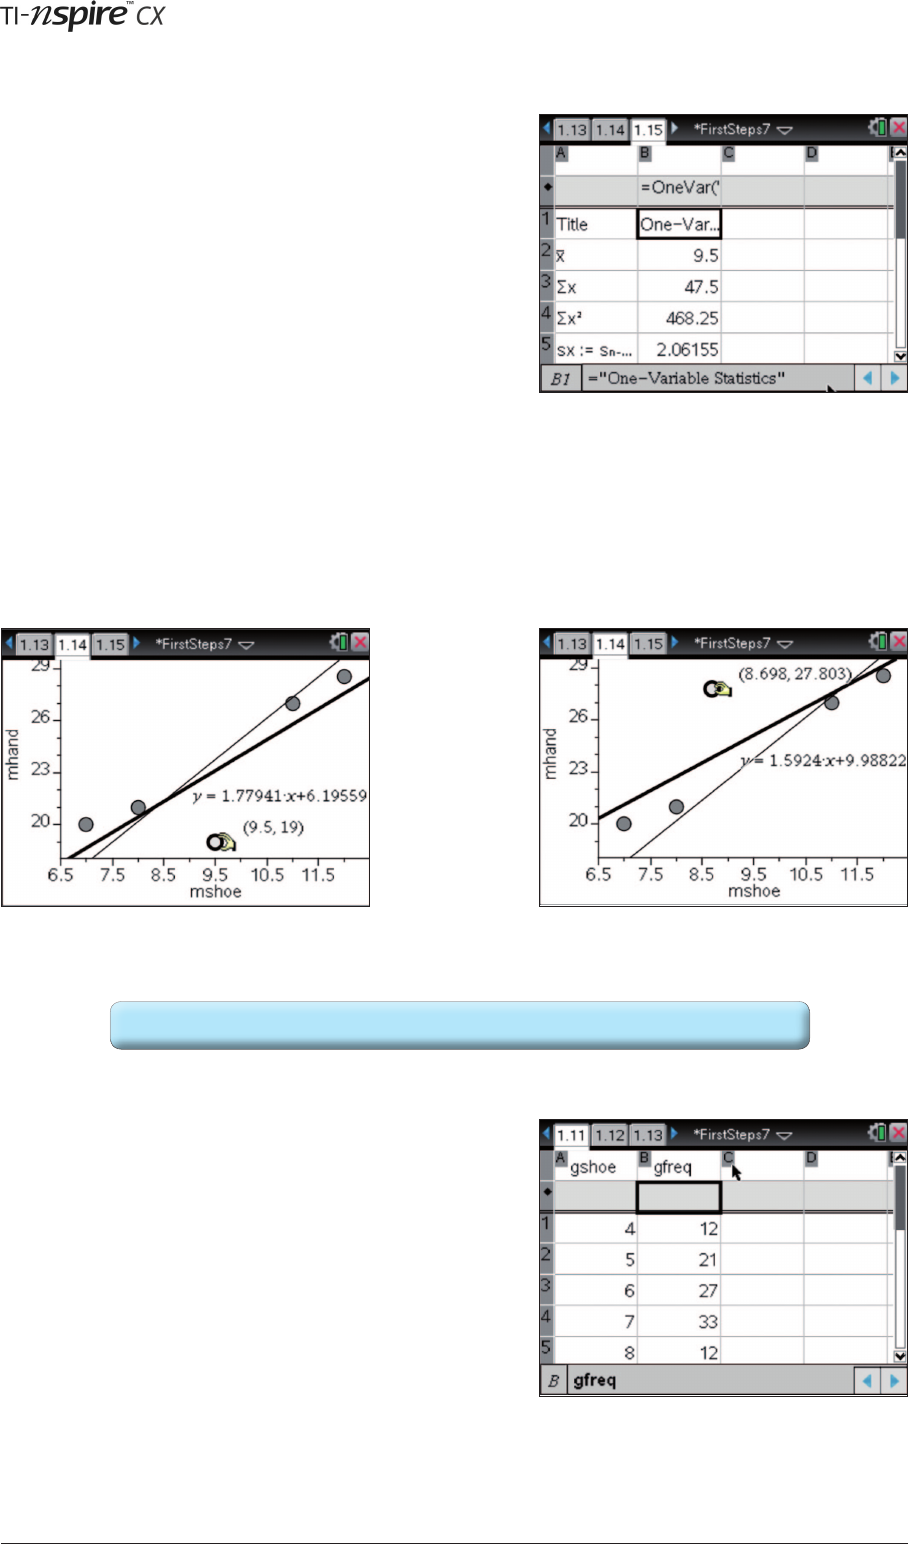
An interesng feature is the ability to drag ploed points
around charts, thus changing the original data. Go back to
the page on which you created the scaerplot for male hand
spans and shoe sizes. You le the plot showing the y=mx+b
regression line and equaon.
Move the cursor to a point very near the line of best t. The cursor changes to a hand with a nger poinng
upwards when it is poinng to a data point. Click and hold x.
Move the cursor to invesgate the eect that moving this point has on the regression line. Below, the point has
been moved to the top of the screen for maximum eect.
In the previous tutorial we entered some grouped data for
shoe sizes. We will now explore some of the ways we can
work with that data using TI-Nspire. Start by returning to the
page we created in the previous tutorial.
We can use the same process we used above to nd summary
stascs for this frequency data.
Sets of stascs
… to here.The eect of moving a point from here …
This shows the eect of changing a single hand-span value from 21cm to 32cm


