


DNM-UNIX Release 4.0 Installation and Getting Started
1 Overview
Product Description
December 2001
Page 20
DEFINITY
Network
Management
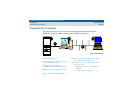
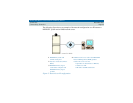
DNM provides users with graphical and tabular tools to monitor the status and
performance of a network of supported systems and external devices.
DNM collects configuration, fault, and performance data from the Proxy Agent via
Simple Network Management Protocol (SNMP) and displays the data in text, tables, and
graphic formats.
The primary features of DNM include:
• Graphical User Interface (GUI) -- The DNM main window contains a navigation
tree that lists all the supported system and displays a colored alert symbol that
indicates highest exception level. You can expand the list to view all of the
configuration components and specific alert symbols for each component.
• Configuration -- You can view the configuration and administered properties of all
supported systems (managed nodes) in both a graphic view and a table view.
• Administration -- You define the system-wide parameters for the features below:
– Data collection -- You define the parameters for the data to be collected from
each system, including the type of data, the schedule for collecting data, and the
length of time to store the data.
– Exception logging -- You define the conditions to log exceptions for
performance thresholds, faults, and system errors.
– Exception alerting -- You specify the alert levels for exceptions from each
supported system. Alert levels may include exceptions that are critical, major,
minor, or warning. The alert level and location of the exception appear in the
main window as long as the exception exits.
• Report Manager -- You can define the parameters for individual reports for all or
selected systems. The report options include: