


REQUIREMENTS/SPECIFICATIONS
2-14
NOTE: Transmitter Power decreases as temperatures rise and increases
as temperatures fall. Use the Output Power Coefficient to calculate
increased or decreased power output for an operating environment. For
example, the typical power output at 25
°
C is -16.4 dBm.
For a 4
°
C temperature increase, multiply the typical coefficient
(-0.15 dBm) by four and add the result to typical output power
(4 x -0.15 dBm + -16.4 = -17.0).
NOTE: The transmitter power levels provided above are Peak Power
Levels after optical overshoot. Use a Peak Power Meter to correctly
compare the values given to those measured on any particular port.
When measuring power levels with an Average Power Meter, add 3 dBm
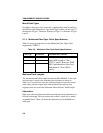
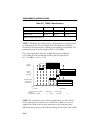
Fall Time 2.5 nsec 2.2 nsec 5.0 nsec
Duty Cycle 50.1% 49.6% 50.7%
Bit Error Rate: Better than 10
-10
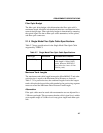
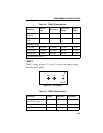
Table 2-9. TPIM-F3 Specifications
Parameter Typical Minimum Maximum
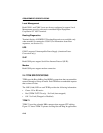
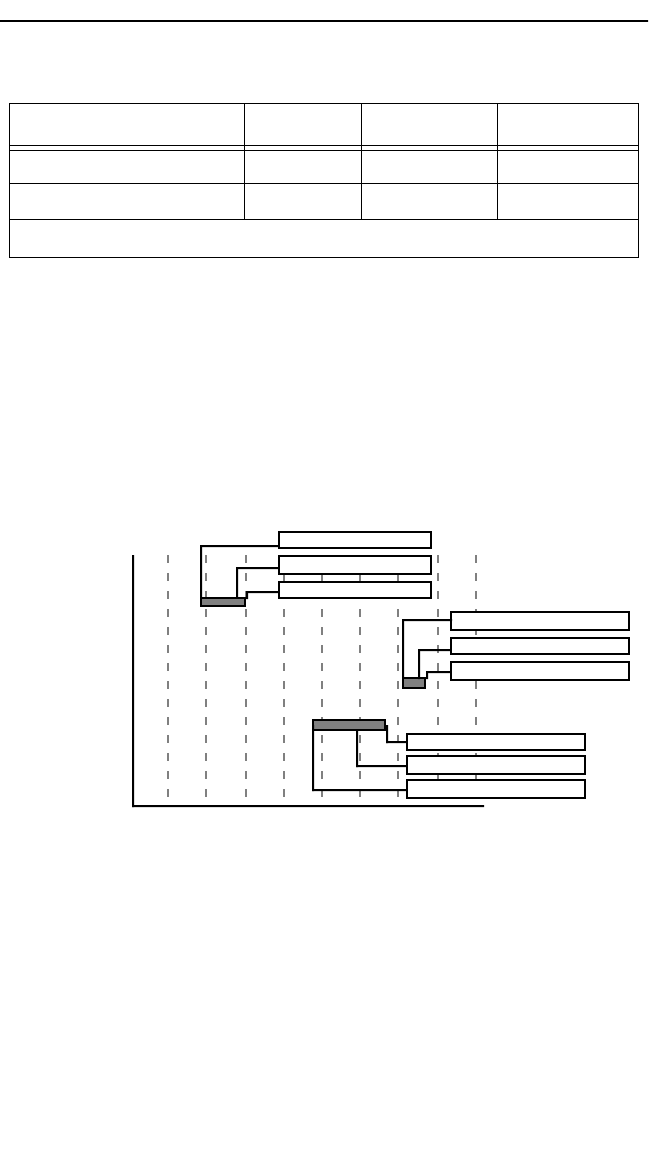
Receive
Sensitivity
dBm
Less Power
More Power
-40 -35 -30 -25 -20 -15 -10 -5 0
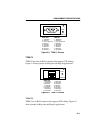
Maximum
Receive
Input Power
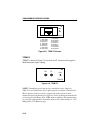
Transmitter Power*
(At 25°C into
8.3/125µm fiber)
Minimum Sensitivity (-30.0)
Typical Sensitivity (-31.0)
Maximum Sensitivity (-36.0)
Maximum Receive Input (-6.99)
Typical Receive Input (-7.5)
Minimum Receive Input (-9.72)
Maximum Transmit Power (-12.0)
Typical Transmit Power (-15.5)
Minimum Transmit Power (-21.0)
* Transmit Power Typical Power Minimum Power Maximum Power
Coefficient
(See Note Below)-0.15dBm/ °C -0.12 dBm/ °C-0.18 dBm/ °
C