86 MetaFrame Presentation Server Reviewer’s Guide
• Determine which custom administrators can generate current reports, summary
reports, or Billing reports
• Ensure that administrators receive alerts only for those servers for which they
have responsibility
Identifying Status Icons
For each server in your system, colored status icons (visual alarms) show the status
of each monitored condition or metric.
During installation, Resource Manager automatically configures a set of limits for
the metrics that apply to each server. If the value of a metric falls outside normal
limits, a visual alarm is displayed to warn you. You may be required to alter these
limits to suit your specific MetaFrame Presentation Server environment.
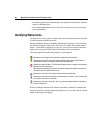
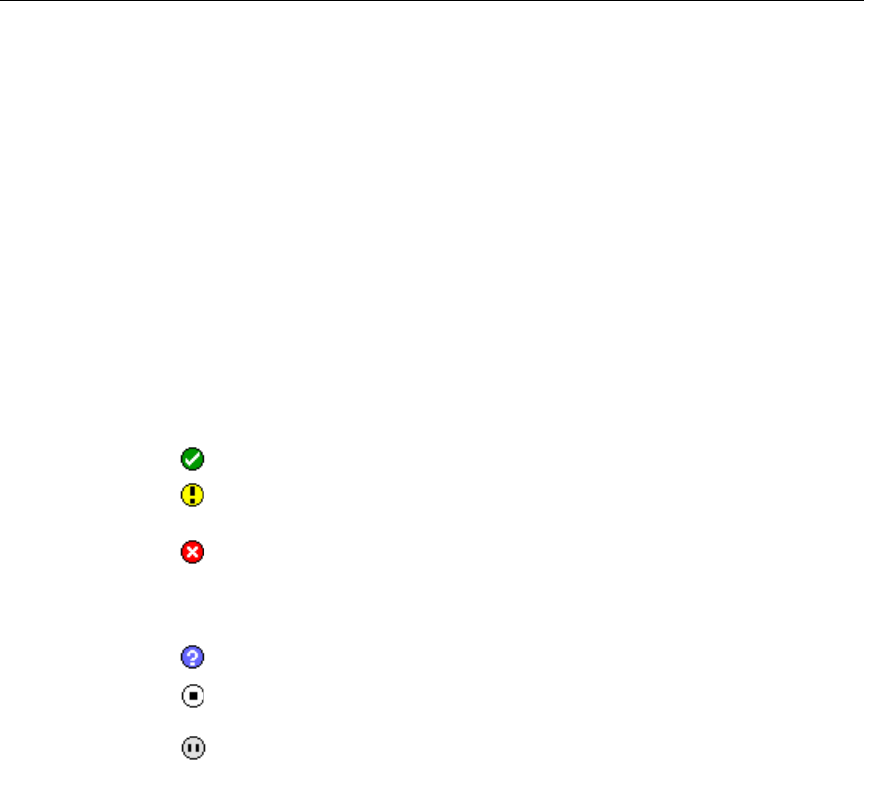
The following table describes the meaning of each condition:
Resource Manager determines the status of each alarm condition by sampling the
statistics associated with the monitored condition every 15 seconds, and the colored
Status Icons change accordingly.
Represents normal operation where the value of a metric falls within set limits.
Represents a warning where a problem may be developing that requires further analysis to
improve performance or to prevent the situation from becoming worse.
Represents a problem condition. This often means that some action is required to provide better
application or server performance.
Both yellow and red indicators occur when the value for a metric falls outside the normal limits
and remains there for a defined period of time.
Represents a metric that is not yet active and requires further configuration
Represents a metric that is set to “Sleep” and whose status is “unknown.” This icon is also used
(for all metrics) if the server is unlicensed.
Represents a metric that is set to “Idle”; that is, you have suspended notification of the metric’s
status for a fixed period.


