


DSP-100/2000
Users Manual
7-20
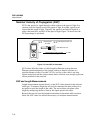
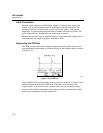
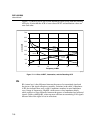
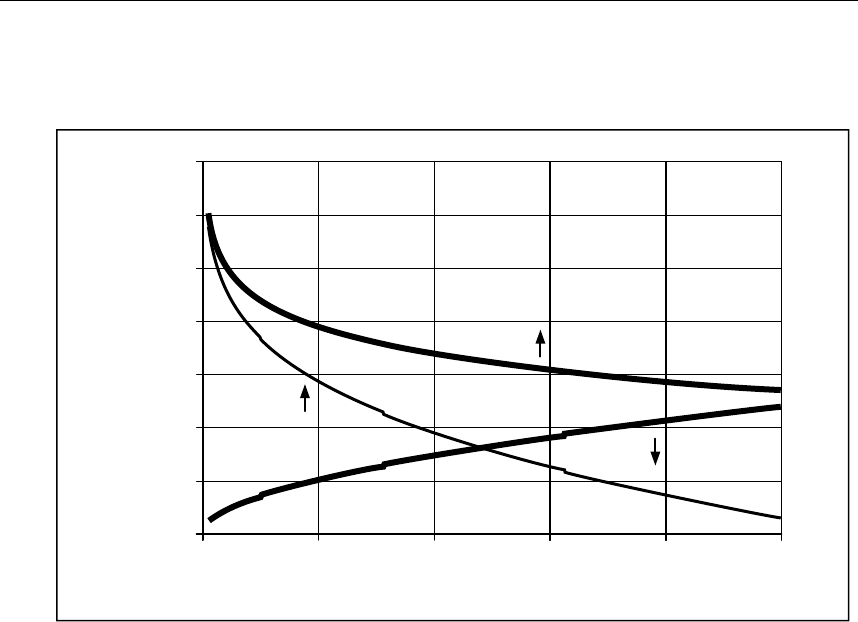
Figure 7-11 shows a plot of NEXT and attenuation limits, along with the resulting
ACR plot. Notice that the ACR is lower where NEXT and attenuation values are
near each other.
70.0
NEXT
GOOD
ATTEN.
GOOD
0 100
Frequency in MHz
Limit in dB
60.0
50.0
40.0
30.0
20.0
10.0
0.0
20 40 60 80
ACR
GOOD
gc37f.eps
Figure 7-11. A Plot of NEXT, Attenuation, and the Resulting ACR
RL
RL (return loss) is the difference between the power of a transmitted signal and
the power of the signal reflections caused by variations in the cable’s impedance.
A RL plot indicates how well a cable’s impedance matches its rated impedance
over a range of frequencies. High RL values mean a close impedance match,
which results in a large difference between the powers of transmitted and reflected
signals. Cables with high RL values are more efficient at transmitting LAN signals
because little of the signal is lost in reflections.