


Autotest
Autotest Results for Twisted Pair Cable
3
3-11
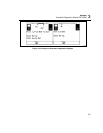
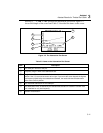
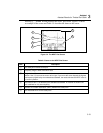
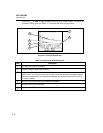
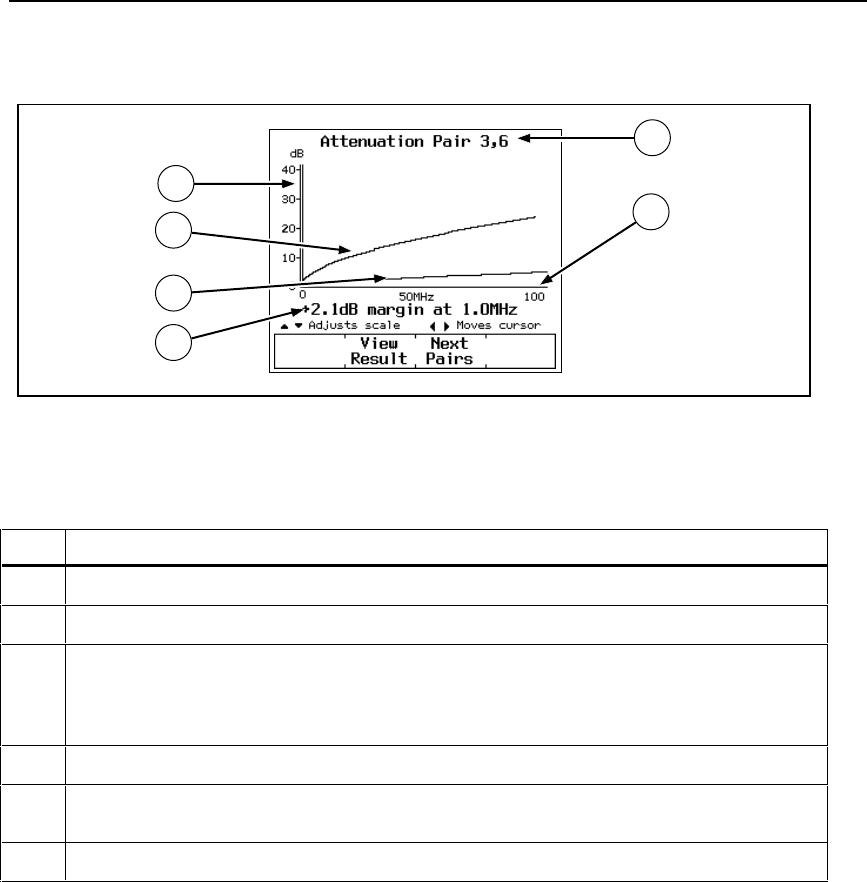
Pressing @ View Plot produces the attenuation plot screen. Figure 3-3
shows an example of the screen and Table 3-3 describes the items on the screen.
5
1
2
6
4
3
gc10c.eps
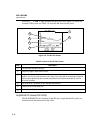
Figure 3-3. The Attenuation Plot Screen
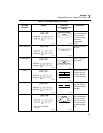
Table 3-3. Items on the Attenuation Plot Screen
Item Description
1
The cable pair relevant to the plot.
2
Frequency range in MHz of the attenuation test.
3
Margin is the difference between the limit and measured values plotted at the cursor’s
position. Use L R to move the cursor left or right. If you move the cursor beyond the highest
test frequency specified by the selected test standard, the readout shows the attenuation
value at the cursor’s position.
4
The measured attenuation for the cable pair.
5
The attenuation limits, as defined by the selected test standard. A crosshair is shown if the
limit is defined for only one frequency.
6
Decibels of attenuation.